Download
1 / 20
200 likes | 345 Views
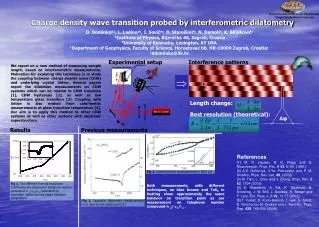
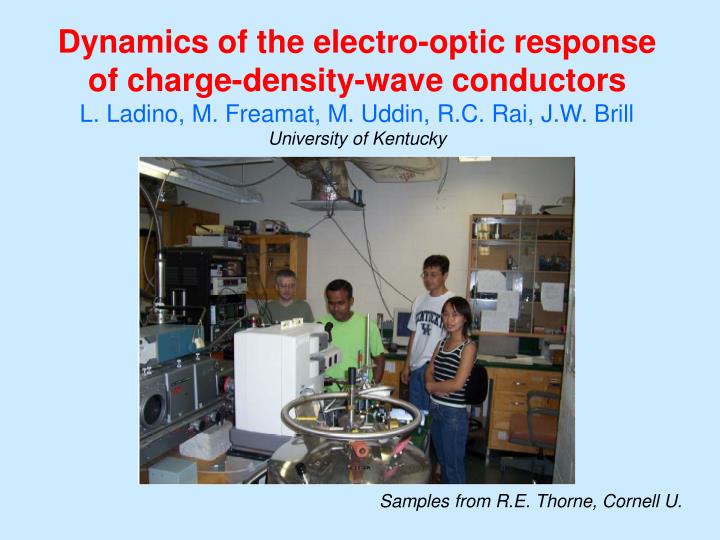
Dynamics of the electro-optic response of charge-density-wave conductors L. Ladino, M. Freamat, M. Uddin, R.C. Rai, J.W. Brill University of Kentucky. Samples from R.E. Thorne, Cornell U.

E N D
Dynamics of the electro-optic response of charge-density-wave conductors L. Ladino, M. Freamat, M. Uddin, R.C. Rai, J.W. Brill University of Kentucky Samples from R.E. Thorne, Cornell U.
This CDW strain (df/dx) profiles were measured in NbSe3 by transport (Cornell) and x-ray (Grenoble) measurements. [Note: since xj = ja + d cos(qx + f),df/dx ≡ Δq] Time after current reversal current conversion Into sliding CDW contact strain bulk polarization bulk polarization
Electro-transmittance of blue bronze (K0.3MoO3) For photon energies less than the CDW gap and voltages near threshold, the infrared transmission (T) increases at the positive current contact and decreases at negative. • (DT/T ~ 0.5% for ~ 5mm thick sample (T ~ 3%) and transverse polarization.) • The spatial variation was similar to the NbSe3 strain variation, and we assumed that DT/Tα ∂φ/∂x. Extra strain near (~ 100mm) contact for V > VT (dc current threshold). DT / T (%) Linear variation for V ≤ VT: polarization of CDW (when depinned in interior)
Broadband changes in transmission due to intraband absorption of thermally excited electrons screening the CDW deformation. Also: phonons affected (DG ~ Dn ~ 0.01 cm-1) by the CDW strain; these changes dominate the electro-reflectance. E conducting chains
Use the electro-optic response to measure the frequency, voltage, and spatial dependence of CDW “repolarization”(without multiple contacts). IR Microscope Electro-Reflectance: DR = R(V+) – R(V-) Electro-Transmittance: DT = T(V+) – T(V-) w
TaS3T = 80 K, n = 860 cm-1, parallel polarization, w/2p = 253 Hz left contact 150 mV 95 mV 60 mV Spectra and spatial dependence may be affected by diffraction effects and irregular (micro-faceted) surface.
TaS3, #1, Frequency of peak in quadrature and shoulder in in-phase component increase with increasing voltage: →CDW repolarization time decreases with increasing voltage. DR/R = (DR/R)0 / [1 – (w/w0)2 + (-iwt0)g] (g < 1: distribution of relaxation times (t) broadens.)
Relaxation time t0 strongly V dependent. • Delay time (~ 100 ms) not strongly V-dependent. • Delay time greater for positive repolarization than negative. • Delay and relaxation times much longer than for NbSe3.
NbSe3 Time after current reversal Reverses rapidly at contact but more uniformly in center: strain reversal driven by local strain and CDW current, Delay ~ few ms (away from contact). No delay at contact. (We have 50 mm resolution.)
TaS3 DR/R = (DR/R)0 / [1 – (w/w0)2 + (-iwt0)g] • t0 V-p, p ≈ 1.5, with no (obvious) divergence near dc thresholds. • t0 increases away from contact, where strain (∂φ/∂x) decreases. (Similar to NbSe3 results: repolarization is driven (partly) by local strain.) • g decreases (distribution of t’s broadens) as approach onset. • Inertia has no strong voltage dependence and increases (slightly) away from contact. w0 / 2p (kHz)
Blue Bronze, Crystal #1, 80 K, n = 850 cm-1, 25 Hz Contact strain only ~ 50 mm Bulk strain “Zero strain” position depends on voltage =VT
Blue Bronze #1, T = 80 K, R: 850 cm-1; T: 820 cm-1; 50 mm resolution 253 Hz, x=0 X=0, 2VT 253 Hz, 2VT in-phase DR/R and DT/T have same frequency, position, voltage dependence → CDW strain (and current) uniform through cross-section. - quadrature
Blue Bronze #1 Electro-Transmittance, T = 80 K, n = 820 cm-1 Fits to: DT/T = (DT/T)0 / [1 – (w/w0)2 + (-iwt0)g] (w0 strongly position dependent) (doesn’t include decay for frequencies < Wx/2p ~ 50 Hz)
Blue Bronze #2, T = 80 K, n = 890 cm-1 ? Time constants (t0, w0-1) an order of magnitude larger than for crystal #1 !! ?
Blue Bronze, T = 80 KDT/T = (DT/T)0 / [1 – (w/w0)2 + (-iwt0)g] • t0 ~ V-1 (#1),1/V-2 (#2) • ? time scales much longer for #2 than #1 ? • g ~ 1 for #1, but decreases (distribution of relaxation times broaden) at small voltages for #2. • Relaxation time increases slightly away from contact • Delay time (w0-1) increases rapidly as move away from contact. (Inertia is NOT a contact effect.) #2, #1 ▲, ▲ … x = 0 ♦, ♦… x = 100 mm ■, ■ … x = 200 mm
DECAY OF ELECTRO-OPTIC RESPONSE Expected response to low-frequency square-wave Wx/2p is cross-over frequency (no clear V or x dependence).
The CDW strain is not expected to decay (and no decay was observed in NbSe3 transport). However, the CDW force (gradient of decay) was found to decay (tdecay ~ 20 ms). Could the electro-optic response have a contribution from the CDW force (mechanism ???) Adelman, et al
Summary We used electro-optic response as a non-perturbative probe of CDW repolarization dynamics in blue bronze and TaS3. The response is governed by three (voltage, position, and sample dependent) time constants: Relaxation time 100 ms → 20 ms [t0 ~ V-p (p=1-2): why dependence so weak?] Delay time w0-1: < 40 ms → 3 ms ? Why so long ? Decay time Wx-1: 2 ms → > 80 ms: ? What is this ?
Critical Measurements ?: Must overcome unstable peak (#1) or increase in g (#2) Blue Bronze #2 Blue Bronze #1