Download
1 / 26
280 likes | 404 Views
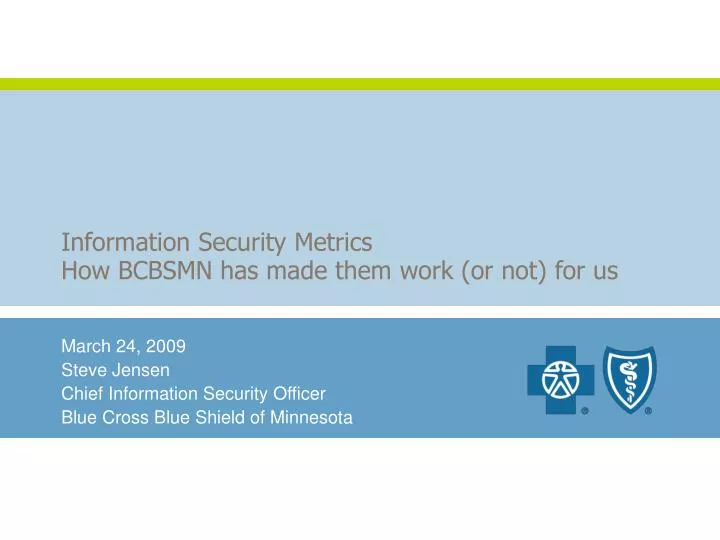
Information Security Metrics How BCBSMN has made them work (or not) for us. March 24, 2009 Steve Jensen Chief Information Security Officer Blue Cross Blue Shield of Minnesota. Agenda. Why measure? What questions are we trying to answer? How do we gather the information?

E N D
Information Security MetricsHow BCBSMN has made them work (or not) for us March 24, 2009 Steve Jensen Chief Information Security Officer Blue Cross Blue Shield of Minnesota
Agenda • Why measure? • What questions are we trying to answer? • How do we gather the information? • Who is the audience and how do we present it? • What lessons have we learned?
Metrics 101 What are Metrics? Textbook Definition Metrics is a management tool designed to facilitate decision-making and improve performance and accountability through collection, analysis, and reporting of relevant performance-related data. Metrics is simply a standard or system of measurement. My Take on it A way for you to have insight into the success (or failure) of your security program. If must either give you insight to drive your decision making, or help to sell/justify your program. If it doesn’t do either, then question why you measure it.
Of course, there are other reasons… • Regulatory Compliance – although not always explicitly stated in regulations, you can’t effectively operate a security program without measuring it. Besides – FUD never worked… • Executive Management Awareness – you need to be able to translate the technical IT gibberish into what executives really care about. What cost am I avoiding or what revenue am I getting. • Trending for Information Security Operations – more for you to make decisions and understand impacts of business choices • Developing Baselines to understand where our information security posture is currently – especially helpful in setting and measuring bonus and performance criteria • Helps to define “Secure” – when does security meet the overinvestment curve? • Helps to define “holes” or an “information security strategy” – fix what needs fixing, and prioritize your work
What questions are we trying to answer • How secure are we anyway? • What are our priorities? • How efficient are we in delivering our service? • Are we trending in the right direction? • When do we see a diminishing rate of return, if any? • How do we add value?
Must be able to quantify risks Compliance Fines Brand Erosion Loss of Customer Confidence Litigation
Another Example CEO inquiry: What impact is economy having on your team?
Another example CIO Inquiry Are we spending too much or too little on security? Where do we compare to industry norms?
Benchmark Assessment Process • Optimal Industry Benchmarks: • Industry • Department of Defense – x.x • Financial Institutions – x.x • Healthcare (provider) – x.x • Insurance – x.x • Blue Cross Blue Shield of Minnesota • BCBS MN established goal – x.x • BCBS MN 2006 attainment – x.x • BCBS MN 2008 estimate – x.x
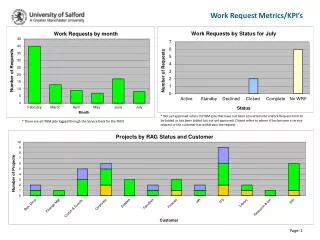
How do we gather the information • Most products come with dashboards that are not fully used – use them! • Qualys • IDS • Arcsight • Websense • Etc. • Plain old bean counting – only if data is utilized and has integrity • Build in metrics in system design when developing or fixing broken business processes as part of requirements • Request system • Role management • Risk management
How do we present the metrics? • Rule #1 – know your audience! • Technology areas – technical reports/gap analysis/details • Monthly “state of security” report • Chief Information Officer • Chief Privacy Officer • VP Audit and Risk Management • Ad-hoc reporting and extracts • CEO/CFO and directs • Board
Lessons Learned • Not a one time process – needs constant honing • Don’t fall in love with a metric that isn’t providing you value – be willing to toss and replace • You don’t always have to report every metric every month – rotate the story • Use your metrics as a management team to drive decisions. Don’t just measure for measurement sake • Metrics and measurements should tell the story without having to read into it too much. They should be transparent.
Mocked Data – Examples of MetricsThis Data does NOT reflect BCBS and is an example only for discussion. Monthly Scorecard
Mocked Data – Identity and Access ManagementThis Data does NOT reflect BCBS and is an example only for discussion.
Mocked Data – Threat and Vulnerability ManagementThis Data does NOT reflect BCBS and is an example only for discussion.
Mocked Data – Governance, Risk, and ComplianceThis Data does NOT reflect BCBS and is an example only for discussion.