Download
1 / 8
80 likes | 88 Views
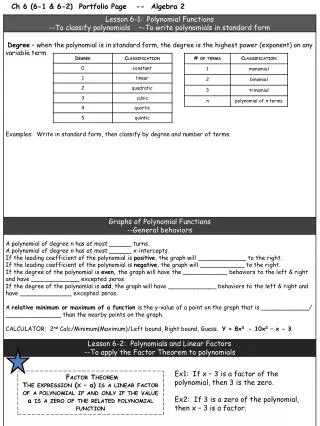
ALGEBRA 2 LESSON 6-1. Ch. 6.1 Polynomial Functions. 6-1. Degree of a polynomial. Go to chart on page 301. Polynomial Functions. ALGEBRA 2 LESSON 6-1. Write each polynomial in standard form. Then classify it by degree and by number of terms. a. 9 + x 3 b. x 3 – 2 x 2 – 3 x 4.

E N D
ALGEBRA 2 LESSON 6-1 Ch. 6.1 Polynomial Functions 6-1
Degree of a polynomial • Go to chart on page 301
Polynomial Functions ALGEBRA 2 LESSON 6-1 Write each polynomial in standard form. Then classify it by degree and by number of terms. a. 9 + x3 b.x3 – 2x2 – 3x4 –3x4 + x3 – 2x2 x3 + 9 The term with the largest degree is x3,so the polynomial is degree 3. The term with the largest degree is –3x4, so the polynomial is degree 4. It has two terms. The polynomial is a cubic binomial. It has three terms. The polynomial is a quartic trinomial. 6-1
Check understanding • p. 301 # 1 B and C
xy 0 2.8 2 5 4 6 6 5.5 8 4 Linear model Quadratic model Cubic model Polynomial Functions ALGEBRA 2 LESSON 6-1 Using a graphing calculator, determine whether a linear, quadratic, or cubic model best fits the values in the table. Enter the data. Use the LinReg, QuadReg, and CubicReg options of a graphing calculator to find the best-fitting model for each polynomial classification. Graph each model and compare. The quadratic model appears to best fit the given values. 6-1
Check understanding • Example 2 page 302
Number of Employees Year 1975 60 1980 65 1985 70 1990 60 1995 55 2000 64 To estimate the number of employees for 1988, you can use the Table function option of a graphing calculator to find that ƒ(13) 62.72. According to the model, there were about 62 employees in 1988. Polynomial Functions ALGEBRA 2 LESSON 6-1 The table shows data on the number of employees that a small company had from 1975 to 2000. Find a cubic function to model the data. Use it to estimate the number of employees in 1988. Let 0 represent 1975. Enter the data. To find a cubic model, use the CubicReg option of a graphing calculator. Graph the model. The function ƒ(x) = 0.0096x3 – 0.375x2 + 3.541x + 58.96 is an approximate model for the cubic function. 6-1
Homework • Page 303, Exercises: 1, 5, 9, 25, 29, 31, 33 -55 (EOO), 63, 67