Download
1 / 31
500 likes | 1.45k Views
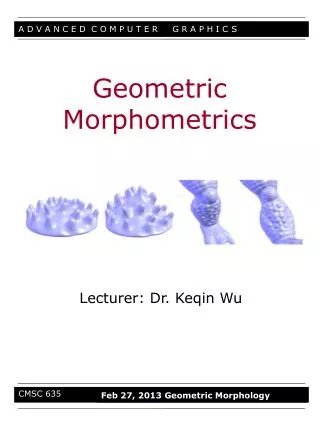
Introduction to Geometric Morphometrics. François Gould, Ph.D. What is geometric morphometrics ?. A increasingly common buzzword. What is geometric morphometrics ?. A toolkit of methods for the numerical analysis of 2D and 3D shape variation. Several different approaches!.

E N D
Introduction to Geometric Morphometrics François Gould, Ph.D.
What is geometric morphometrics? • A increasingly common buzzword
What is geometric morphometrics? • A toolkit of methods for the numerical analysis of 2D and 3D shape variation. • Several different approaches!
What does geometric morphometrics examine? • Form: aspects of geometry invariant to rotation, translation, reflection • Most geometric morphometric approaches also scale: leave “pure shape”. • Size can be examined separately with a metric
About Size and Shape • Key concepts in understanding the morphology of organisms. • Size: absolute difference in magnitude between objects • Shape: relative differences in geometry between organisms • These concepts are tricky!
Allometry and Scaling • The allometric relation is a power relation: • y=m*xb or ln(y)=b*ln(x)+ln(m)
Where did geometric morphometrics come from? • Result of a synthesis of two trends (Bookstein, 1991)
Quantitative representation of shape I • Role of coordinate points: the landmark concept 3 0 5 -5 -5 7
Quantitative representation of shape II • Mathematical theory of shape space • A space where each point defines a single configuration of landmarks • Classical shape space non-euclidean: projection
Getting into shape space: the Procrustes transform • Translate, rotate, scale. Least squares fit • Creates Procrustescoordinates
Analysis of Procrustes coordinates • Project the shapes into a tangent space passing through the mean shape • Calculate the variance-covariance matrix of the projected procrustes coordinates • These can either be analysed directly (Principal components) or using the Thin Plate Spline (Partial and Relative warps)
The Procrustes transform: problems • Assumptions about variance: equal distribution • Iterative algorithm without true solution: data dependent • May be statistically problematic: requires estimation of nuisance parameters
Other approaches • Bookstein coordinates, Resistant fit: different variance assumptions • EDMA: Euclidean distance matrix analysis • Calculates all pairwise distances and compares them as ratios • Does not require estimation of nuissance parameters • Eigenshape approaches: Phi function (angle change). Ideal for outlines.
On landmarks • Pivotal in geometric morphometrics
Criteria for landmark selection • Landmark homology • Classical three-tier formulation (Bookstein 1991) • Type I: meeting of tissue types (“true” landmarks) • Type II: maxima of curvature (orientation independent) • Type III: extremal points
Limitations of the Bookstein paradigm • Many structures cannot be reduced to type I landmarks
Methods for the analysis of curves and surfaces • Semilandmarks approaches (Bookstein, 1997) • Fourier transform • Eigenshape approaches (Macleod and Rose, 1993, Macleod 1999)
Limitations of the Bookstein paradigm • Cannot deal with novel structures. PERISSODACTYL ARTIODACTYL
What is landmark homology? • Individual landmarks are not biologically homologous. • Moving towards a recognition of importance of homology of the underlying biological structure. • Even Bookstein now agrees! (Gunz et al., 2005) • Think about the BIOLOGY, not the theory
Uses of Geometric Morphometrics • Data exploration • Exploration of distribution of data (ordination) • Exploration of coordinated shape change (visualisation) • Source of hypothesis • Hypothesis testing: • Development studies (fluctuating asymmetry, integration) • Evolutionary (modularity, morphological evolution) • Ecomorphology
Choose the best tool • What is your biological question? • Data exploration • Hypothesis testing • Type of data: • 2D or 3D? • Landmark? Outline? Surface? • Sample size?
Collecting your data • From specimens? • Microscribe • From photographs • ImageJ • Be VERY careful about parallax • From 3D models • Laser scans • CT scans
Measurement Error • Morphometric data can be assessed for error • Global measurement error • Error associated with landmarks • Need to assess each stage of data collection protocol for error • Error less of a problem in cross-taxonomic studies
Transforming your data into shape coordinates: WISYWIG software • Written by researchers, increasingly powerful and easy to use • TPS suite • MorphoJ • WinEDMA • Can be found at SUNY morphometrics website • http://life.bio.sunysb.edu/morph/ • REFLECT BIASES OF AUTHORS!
Transforming your data into shape coordinates: the hard way • Can code analysis in Matlab, Mathematica and R. • Full geometric morphometrics R package: Geomorph(Adams, 2012) • Often necessary if working with analyses outside what other researchers do. • Get on the morphmet listserv: active community.
Analysis • Exploratory analysis • Ordination (PCA or Relative warps) • Shape change visualisation • Discrimination • CVA • Discriminant function • Hypothesis testing • MANOVA • Regression • 2 Block Partial least squares
Exploring your shape space • All methods allow visualisations of changes in shape. • HOWEVER, need to know if you are in a shape space or not: different approaches to modelling in shape space (e.g. PCA) versus non-shape space (e.g. CVA). • Do not overinterpret your shapes: do not extrapolate beyond data
Example: Ecomorphological pattern in distal femoral variation