Download
1 / 29
290 likes | 557 Views
Arab Population In the West Bank & Gaza The Million Person Gap. PCBS Projection 2004 Population 3.8 Million. Presentation at the Sixth Herzliya Conference January 23, 2006. Fewer Births. Net Negative Migration. Jerusalem Arab Population. USA Research Team Bennett Zimmerman

E N D
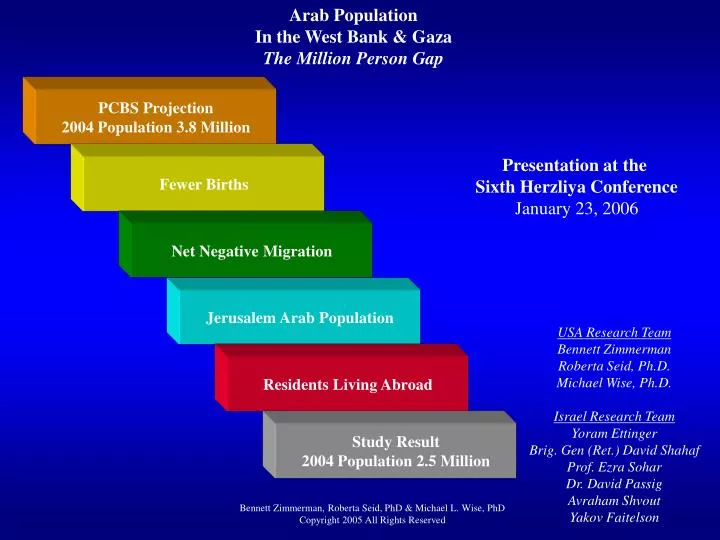
Arab Population In the West Bank & Gaza The Million Person Gap PCBS Projection 2004 Population 3.8 Million Presentation at the Sixth Herzliya Conference January 23, 2006 Fewer Births Net Negative Migration Jerusalem Arab Population USA Research Team Bennett Zimmerman Roberta Seid, Ph.D. Michael Wise, Ph.D. Israel Research Team Yoram Ettinger Brig. Gen (Ret.) David Shahaf Prof. Ezra Sohar Dr. David Passig Avraham Shvout Yakov Faitelson Residents Living Abroad Study Result 2004 Population 2.5 Million Bennett Zimmerman, Roberta Seid, PhD & Michael L. Wise, PhD Copyright 2005 All Rights Reserved
Israeli and Palestinian Population Estimates West Bank and Gaza (1995 & 2005) Millions of People 4.0 4.0 • PCBS 2004 population total for • the West Bank and Gaza was • 4.0 million, 100% above the ICBS • 1995 figure of 2.0 million. • Such growth would indicate a • compound annual growth rate • over 7% per annum. 3.0 2.0 2.0 1.0 1995 2005 Israel Central Bureau of Statistics Palestine Central Bureau of Statistics Source: ICBS, Final Assessments of Population in Judea, Samaria & Gaza, 1996, Julia Zemel, December 22, 1997; Palestine Central Bureau of Statistics, Demographic Indicators of the Palestinian Terrtory, 1997 - 2015
Arab Population in the West Bank and Gaza 1997 PCBS Census and Projection (1997 - 2015) Millions of People 6.0 • The Palestine Central Bureau of • Statistics (PCBS) forecast was the • basis for future population reports • 1997 Population: 2.78 Million • 2015 Population: 5.81 Million • Mid-Year 2004 Population • reaches 3,827,914 • 1997 – 2004 Annual Growth • Rate of 4.7% • (Highest in the World) 5.0 4.0 3.0 2.0 1.0 ‘97 2000 2005 2010 2015 Source: Palestine Central Bureau of Statistics, Demographic Indicators of the Palestinian Terrtory, 1997 - 2015 When 2004 PCBS population estimate (3.8 million) is combined with Israeli Arab population (1.3 million), the number of Arabs is now almost equal to the number of Jews west of the Jordan River. Given this rapid Arab growth, Israeli Jews will rapidly become a minority
Arab Population In the West Bank & Gaza The Million Person Gap Methodology Population measurement requires accurate recording and verification of: Beginning Base Population + Births - Deaths + Immigration - Emigration = Ending Base Population Study investigated the 1997 PCBS Projection, factor by factor, against data released each year byPA and Israeli governmental agencies.
PCBS Acknowledges Inclusion of Residents Living Abroad (1996 – Mid-Year 1997) BeforeCensus CensusEra Millions of People 4.0 + 24K Half-Year Growth +210K Jerusalem Arabs +438K Census Increase 325K Residents Abroad 113K Additional Increase 3.0 2.783 Million 2.270 Million 2.111 Million 2.0 1.0 0 December 1996 ICBS Report December 1996 PA Ministry of Health June 1997 PCBS 1997 Census (PCBS Mid-Year 1997)
Palestine Central Bureau of Statistics Census Coverage Inclusion of Residents Living Abroad “We counted 325,000 people living outside of the Palestinian lands for more than one year, who carry Palestinian ID cards and can return at any time. This number is a minimum, and is not precise because we could not contact all the families living abroad.” Masur Hassan Abu Libdah Head of PCBS News Conference held at Al-Birah “The First Results of the Census” March 1998 Hebrew & Arabic Transcript Available
Palestine Central Bureau of Statistics Census Coverage Inclusion of Residents Living Abroad http://www.pcbs.org/phc_97/phc_covr.aspx • Census Coverage • A comprehensive population enumeration always depends on the essence and the nature of the census. In general, population censuses cover all persons residing within the limits of a certain country, at a specific time. A population census is based on the following: • De-facto Approach: Based on the enumeration of individuals according to their existence in the area of enumeration at census moment, regardless of their usual place of residence. • De-jure Approach: Based on the enumeration of individuals according to their usual place of residence, regardless of their presence at the census moment. • For the first ever Palestinian census, the de-facto approach was adopted with some exceptions. The census count included the following categories: • A – The Categories underwent complete data collection. • 1. All persons present in the Palestinian territories on the census reference date, irrespective of nationality, purpose of stay and place of residence in the Palestinian territories. • 2. All temporarily living abroad (for one year prior to the night of the reference date) and who have a usual place of residence in the Palestinian territories. Those persons are enumerated as parts of their households. • 3. All Palestinians studying abroad irrespective of the study period and the period of stay abroad along with all Palestinian detainees in the Israeli jails regardless of the detention period. • B – Palestinian abroad: Categories underwent data collection on their numbers and sex only This category includes Palestinians who live abroad for more than one year and who have a usual place of residence in the Palestinian territories and have identity cards (except for students and detainees enumerated in the previous category) irrespective of the purpose of stay abroad.
Israel Central Bureau of Statistics (ICBS) Internal Assessment of West Bank and Gaza Estimates In the 1980s and 1990s, the ICBS conducted periodic assessments of its population data since so much time had passed since its 1967 census. In 1996, it published the following affirmation of its population reports through 1993: “There were efforts to evaluate the population estimates by comparing them to other independent sources, such as the registration of residents in Gaza after the exchange of identity cards, man-power surveys, number of students, etc. These comparisons showed that the differences between the sources are small and non-substantive.” [The Gaza population evaluation was quite specific]: “Comparing the updated population estimates at the end of 1989 with the updated population registry after the exchange of ID cards (in the 2nd half of 1988) showed that the difference in the population estimates and the number of registered residents (after removing those living abroad) with respect to all the residents of Gaza is 2.4%” Source: ICBS, Demographic Characteristics of the Arab Population in Judea, Samaria, and Gaza, 1968-1993, Publication #1025, Page 15, July 1996
PA Central Election Commission (CEC) Eligible Adult Voters Match ICBS Population Records October 2004 & January 2005 Voting Reports Millions of People 2.5 2.0 “Adults expected to be 18 and above by 2004” 1.85M 1.5 M 1.5M 1.5 1.4M 1.3M 13% Abroad 1.3M 1.3M 87% Resident 1.0 0.5 0 • CEC October 2004 Voting Report • 1.3 Million Eligible Voters • Resident in Territories • 200K Eligible Voters Abroad ICBS 1996 + 8 Years PA MOH 1996 + 8 Years PCBS 1997 + 7 Years PCBS Forecast (2004) The October 2004 CEC Voting Report, with specific information on 1.3 million adults living in the Territories, undermines the original 1997 PA Projection and confirms that the 1997 Census Base included Palestinians living abroad. The adult population derived from the 1996 PA Ministry of Health estimate was only 100,000 persons below the adults found on current rolls. The residential base measured by the ICBS in the mid-1990s produces an exact match with the 1.3 million residents found on current CEC voter rolls.
Births/Year PCBS 1997 Projection vs. Births recorded by PA Ministry of Health Thousands of Births/Year 160 120 = PCBS 1997 Projection = PA Ministry of Health 80 40 0 2000 2003 1999 2002 1998 2001 1995 1997 1996 The PCBS developed birth assumptions on top of an enlarged population base. By 2003, the PCBS projected births to exceed 140,000 per year. Actual births were recorded by the PA Ministry of Health at significantly lower levels than those originally forecast by the PCBS.
Births/Year Births recorded by PA Ministry of Health confirmed by PA Ministry of Education Records PA Ministry Of Education 1st Grade Students 6 Years Later Thousands of Births/Year 160 120 = PCBS 1997 Projection = PA Ministry of Health (2003) (2004) 80 40 0 2000 2003 1999 2002 1998 2001 1995 1997 1996 The level of births recorded by the PA Ministry of Health correlate with the school records maintained by the PA Ministry of Education for students entering school.
Immigration/Year PCBS 1997 Projection Net Entries(Exits) In Thousands/Year 160 120 80 40 0 2000 2003 1999 2002 1998 2001 1994/5 1997 1996 The PCBS built in assumptions of mass immigration into the West Bank and Gaza. By 2001, immigration was forecast to exceed 50,000 persons per annum.
Immigration/Year PCBS 1997 Projection vs. Actual Israel Border Data Net Entries (Exits) In Thousands/Year 160 120 = PCBS 1997 Projection 80 = Actual Israel Border Data 40 Post Gulf War I: +25K Post Oslo I 0 2000 2003 1999 2002 1998 2001 1990 1991 1992 1993 1994 1995 1997 1996 The PCBS built in assumptions of mass immigration into the West Bank and Gaza. By 2001, immigration was forecast to exceed 50,000 persons per annum. Actual border data showed net emigration of between 10-20,000 persons each year since 1997. Therefore, the PCBS began to include 60-70,000 persons each year that were not present.
Migration to Israel Officially Counted Only 1993 - 2003 • From 1993 – 2003, over 150,000 residents of the West Bank and Gaza received Israeli IDs • and settled in pre-1967 Israel and Jerusalem under family reunification programs. The portion • since 1997 totals approximately 105,000 persons. • (Source: November 2003 Israel Ministry of Interior Report.) • These figures do not address either: • Unofficial immigrants who have moved over the ‘green-line’ into Israel • Jerusalem residents with Israeli IDs who have moved back from the • West Bank into Israeli controlled Jerusalem.
Study Results Year by Year Detail Population models should be transparent with clearly defined starting, intermediate and ending points, so that researchers can assess the data, factor by factor. Many current estimates use information released by the PCBS to build population forecasts.
Errors in PCBS Projection The Million Person Gap (By Mid-Year 2004) } Millions of People PCBS Projection: 3.83 Million Total 2.42 Million West Bank 1.41 Million Gaza 4.0 Deaths Difference: 33K PA MOH Births Difference: 238K Birth Alterations Difference: 70K 3.5 Immigration & Emigration Error Difference: 310K “The 1.34 Million Person Gap” Migration to Israel Difference: 105K 3.0 Jerusalem Arabs Difference: 210K Residents Living Abroad Difference: 325K Jump Over ICBS Difference: 113K 2.5 Study Results: 2.49 Million Total 1.41 Million West Bank 1.08 Million Gaza 2.0
Population Breakdown By Segment (1967 –2003) Population In Millions 10 9.2 M 1.07 M Gaza Arabs 8.7 M 8 0.98M 7.6 M 1.40 M West Bank Arabs 0.8 M 1.3 M 6.4 M 1.15 M 1.3 M Israeli Arabs 6 0.65 M 5.6 M 1.3 M Jewish Affiliated/ Recent Immigrants 0.95 M 0.5M 1.0 M 0.8 M 5.4M 0.9 M 5.2 M 4 4.6 M Jews 3.7 M 0.75 M 3.9 M 0.35 M 3.5 M 0.6 M 0.4 M 2 2.4 M 0 1967 1985 1990 1995 2000 2003 Combining Study Results with figures from the Israel Central Bureau of Statistics (ICBS) shows the following population picture since 1967.
Population Breakdown (1967 –2003) % Population Entire Land 100 9.6% 9.4% 10.0% 10.8% 11.6% 11.6% Gaza Arabs 15.8% 14.4% 14.9% 15.2% 15.4% 15.2% 80 West Bank Arabs 13.4% 13.6% 13.2% 10.6% 13.7% 14.1% Israeli Arabs 60 Jewish Affiliated/ Recent Immigrants 64.1% 62.8% 61.5% 60.7% 59.7% 59.1% Jews 40 20 0 1967 1985 1990 1995 2000 2003 • Jewish population ratios in Israel and the Territories have been relatively stable since 1967 • -- Jews & Jewish affiliated groups maintain a 59% majority • -- The diverse Israeli Arab group, including Druze, Christian Arabs, and Moslems, has been the fastest growing segment in Israeli society. • Some of this growth has been fueled by migration from the West Bank and Gaza • -- The ratio of Arabs in the West Bank and Gaza has remained at one quarter of the population in the land since 1967 • Many analysts count halachically non-Jewish immigrants from the former Soviet Union as “Palestinian.” • The ICBS defines this group in the larger “Jewish & Other” category • Israel has become more multicultural, but not more “Palestinian Arab”.
Population Breakdown Israel, the West Bank, and Gaza (Begin Year 2004) Israeli Arabs West Bank Arabs Israeli Arabs West Bank Arabs Israeli Arabs Gaza Arabs Jewish Affiliated Jews Jews Jews Israel 81% Jewish 4:1 Jewish/Arab Ratio Israel & West Bank & Gaza 59% Jewish 3:2 Jewish/Arab Ratio Israel & West Bank 67% Jewish 2:1 Jewish/Arab Ratio
Population Growth Rates PCBS Growth Assumptions West Bank & Gaza 2003 Compound Annual Growth Rate 5.0% 4.9% Growth Rate Immigration 1.4% 4.0% 3.9% Birthrate 3.0% 2.0% 1.0% 0% 0.4% Death Rate PCBS Projection From 1997 The PCBS “highest in the world” population growth assumptions were based on high birth rates and massive immigration rates. The PCBS had forecast 4.9% growth for 2003.
Impact of Migration PCBS vs. Study Results West Bank & Gaza 2003 Compound Annual Growth Rate 1.4% 5.0% 4.9% Growth Rate Immigration 4.0% Study Results 3.9% Birthrate Birthrate 3.6% 3.0% 2.1% Growth Rate 2.0% 1.0% 0% Death Rate 0.4% 0.4% Death Rate 0.5% Emigration Abroad PCBS Projection From 1997 Internal Migration 0.6% The West Bank and Gaza experienced robust birth rates but net negative migration has collapsed overall population growth rates. In 2003, actual growth was 2.1%.
Population Growth Rates Growth Rates by Segment 1997 – 2003 Compound Annual Growth Rate Population Growth Rates Forecast by the PCBS in 1997 5.0% 4.7% 4.4% 4.0% 3.3% 2.9% 3.0% 2.1% 2.0% 1.8% 1.0% 0% Israeli Jews Israeli Arabs West Bank Arabs Gaza Arabs From 1997 - 2003, growth in Territories was substantially below the 1998 PCBS forecast. West Bank overall growth rates (natural growth less emigration) were below Israeli Jewish growth (natural growth plus immigration). Israel Arab growth was partially fueled by migration from the West Bank and Gaza.
Total Fertility Rates (TFR) West Bank and Gaza Study Results 1999 - 2003 Total Fertility Rates (TFR) 6.6 Gaza PCBS Household Survey 2004 6.0 G G G G G W 5.2 West Bank W 5.0 W W W 4.0 3.0 2.0 1.0 1999 2000 2001 2002 2003 Source: Israel Central Bureau of Statistics Website, ICBS Annual Yearbook 2004, Tables 3.12, 3.13 and 3.14 PA Ministry of Health Reports 2003 PA Ministry of Health birth data for a residents-only population base yield fertility rates compatible with recent figures found in the PCBS 2004 Household Survey (5.2 for West Bank, 6.6 for Gaza)
Total Fertility Rates (TFR) by Population Segment ICBS and PA Ministry of Health Statistics 1999 - 2003 Total Fertility Rates (TFR) 6.0 5.0 G G Gaza Arabs Israeli Arabs West Bank Arabs Israeli JEWS G G G A A A A A 4.0 W W W W W 3.0 J J J J J 2.0 1.0 1999 2000 2001 2002 2003 Source: ICBS, Israel Statistical Abstract, PA Ministry of Health Reports 2003 The PA Ministry of Health reported lower fertility rates for the West Bank and Gaza than those found in this Study. Comparing this data to ICBS figures for Israeli Jews and Israeli Arabs show a convergence in fertility between Israeli Jews and West Bank Arabs. The PA Ministry of Health computes these statistics by dividing actual births recorded in the field by inflated population figures from the PCBS. As a result, their fertility reports might be too low. The PA Ministry of Health 2005 Annual Report reaffirms their birth figures despite the disagreement with PCBS.
West Bank Phases of Population Growth (1950-2004) Annual Population Growth Rates Late Israeli Period ’85-’95 -- High Growth 3.5% -- Economic Growth -- Some Years of Immigration Early Israeli Period ’67-’85 -- Medium Growth 1.8% -- Health Improvements 4.0% • Life Expectancy Up • Infant Mortality Down -- Steady Emigration 3.0% Oslo Period ’95-’00 -- Medium Growth 2.2% -- Declining Birthrates -- Steady Emigration 2.0% Jordanian Period ’52-61 (20) (33) -- Low Growth 0.9% Rate -- Steady Emigration Post-Oslo Period ’00–‘04 -- Low Medium Growth 1.8% -- Hostilities -- Declining Birthrates -- Steady Emigration 1.0% 1960 1970 1980 1990 2000 1950 Growth rates in the West Bank are experiencing the normal stages of population development Growth rates for the West Bank are approaching levels of a developed Western society and are now similar to growth rates for Israeli Jews.
Arab Population in the West Bank and Gaza 1997 PCBS Census and Projection (1997 - 2015) Millions of People 6.0 1997 Population: 2.78 Million 2015 Population: 5.81 Million 5.0 4.0 3.0 2.0 1.0 1997 2000 2005 2010 2015 Source: Palestine Central Bureau of Statistics, Demographic Indicators of the Palestinian Terrtory, 1997 - 2015
Arab Population in the West Bank and Gaza 2005 PCBS Revised Projection (1997 - 2015) Millions of People 6.0 5.0 • 1997 Population: 2.78 Million • 2015 Population: 5.09 Million 4.0 3.0 2.0 1.0 1997 2000 2005 2010 2015 Source: Palestine Central Bureau of Statistics, Summary Statistics, Palestinian Territory, 1997 - 2015 Two months after the results of this Study were released in January 2005, the PCBS removed all immigration assumptions from 2001 – 2015. This change reduced their population estimate by 200K in 2004 and ¾ of a million by 2015.
Arab Population in the West Bank and Gaza The Million Person Gap (1997 - 2004) Millions of People 6.0 5.0 4.0 1997 Population: 2.11 Million 2004 Population: 2.49 Million ? 3.0 2.0 1.0 1997 2000 2005 2010 2015 Source: Arab Population in the West Bank and Gaza: The Million Person Gap. Zimmerman, Seid, Wise The revised PCBS Projection still includes residents living abroad and Jerusalem Arabs. Births forecast for these groups have moved their estimates far away from actual birth activity. While the PCBS has began to remove immigrants who never arrived, it still needs to remove emigrants and persons who have migrated to Israel every year since 1997.
Arab Population In the West Bank & Gaza The Million Person Gap Contact Information In USA: Mr. Bennett Zimmerman Ph: 310-617-4180 E-mail: ben@pademographics.com Arab Population in the West Bank and Gaza: The Million Person Gap debuted at the American Enterprise Institute in Washington, D.C. on January 10, 2005 The Begin-Sadat Center for Strategic Studies plans to publish a version of the Study. The original study can be found at www.pademographics.com