Download
1 / 22
220 likes | 336 Views
Compression Techniques to Simplify the Analysis of Large Execution Traces. Abdelwahab Hamou-Lhadj and Dr. Timothy C. Lethbridge {ahamou, tcl}@site.uottawa.ca University of Ottawa - Canada IWPC 2002 - Paris. Introduction.

E N D
Compression Techniques to Simplify the Analysis of Large Execution Traces Abdelwahab Hamou-Lhadj and Dr. Timothy C. Lethbridge {ahamou, tcl}@site.uottawa.ca University of Ottawa - Canada IWPC 2002 - Paris
Introduction • Execution traces are important to understand the behavior and sometimes the structure of a software system • Execution traces tend to be very large and need to be compressed • In this presentation, we present techniques for compressing traces of procedure calls • We also show the results of our techniques when applied to two different software systems
Why Traces of Procedure Calls? • Many of today’s legacy systems were developed using the procedural paradigm • The flow of procedure calls can be useful to comprehend the execution of a particular software feature • The level of abstraction of traces of procedure calls tend to be not too low and not too high • Traces of method invocation become crucial when it comes to understand the behavior of object-oriented systems
Traditional Compression Techniques • They are two types of compression techniques: lossy and lossless compression • In Information theory, most of the compression algorithms are based on the same principle (David Salomon, 2000) • Compressing data by removing redundancy • These techniques produce good results, however • The information, once compressed, is no longer readable by humans. • Such algorithms certainly will not help in program comprehension
Trace Compression Steps • Preprocess the trace by removing the contiguous redundancies due to loops and recursion • Represent the trace as a rooted ordered labeled tree • Detect the non-contiguous redundancies and represent them only once • this problem is also known as the common subexpression problem and can be solved in linear time • Analyze the compressed version and estimate the gain
Preprocessing Stage • Redundant calls caused by loops and recursion tend to encumber the trace and should be removed • the number of occurrences is stored to reconstruct the original trace • Removing the redundant calls is one form of compression that could make the trace more readable • If the trace is perceived as a tree, removing contiguous redundancies reduce the depth of the tree and the degree of its nodes
The Common Subexpression ProblemIntroduced by J.P. Downey, R. Sethi and R.E. Tarjan • “Any tree can be represented in a maximally compact form as a directed acyclic graph where common subtrees are factored and shared, being represented only once” - Flajolet, Sipala and Steyaert • The process of compacting the tree is known as the common subexpression problem also called “subtree factoring” • If we consider trees with a finite number of nodes so that the degrees are bounded by some constant ... “The compacted form of a tree can be computed in expected time O(n) using a top-down recursive procedure in conjecture with hashing...” - Flajolet, Sipala and Steyaert
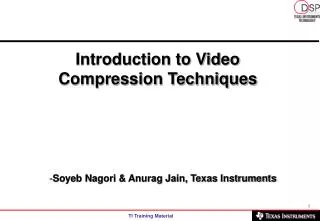
A 5 D E 3 4 A E D C B B C C D 5 4 3 2 1 1 2 2 3 B C 1 2 Example Input tree: 9 nodes and 8 links The Compressed form: 5 nodes and 6 links
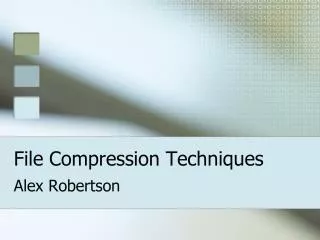
The Algorithm Introduced by P. Flajolet, P. Sipala, J.–M. Steyaert and improved by G. Valiente • The algorithm assigns a positive number called certificate to each node • Two nodes have the same certificate if, and only if the trees rooted at them are isomorphic. • The certificate of a node n is obtained by • building a sequence [L(n), a1, .... , am] called the signature of the node, where L(n) is the label of the node, a1,..., am are the certificates of the children of the node. • The certificates and signatures are stored in a global table
Node Signature Certificate A [A, 4, 3] 5 E [E, 3, 2] 4 D [D, 2, 1] 3 C [C, 0, 0] A 2 5 B [B, 0, 0] 1 D E 3 4 B C C D 1 2 2 3 B C 1 2 Example
The Algorithm Steps (iterative version) • The algorithm performs a bottom-up traversal of the tree using a queue • 1. For each node n 2. Build a signature for n 3. If the signature already exists in the global table then 4. Return the corresponding certificate Else 5. Create a new certificate 6. Update the table 7. Assign the certificate to the node • If the degree of the tree is bounded by a constant and a hash table is used to store the certificates then this algorithm performs in linear time
Experiment • We experimented with traces of the following systems: • XFIG (a drawing system under UNIX) • A real world telecommunication system • We are interested in the following results: • The initial size of the trace n • The size of the trace after preprocessing it n1 • The compression ratio r1 such that r1 = n1 / n • The size of the trace after using the common subexpression algorithm n2. • The compression ratio r2 such that r2 = n2 / n
Trace n n1 r1 (%) n2 r2(%) 1 2198 623 28.34 218 9.92 2 9076 647 7.13 223 2.46 3 5140 889 17.30 236 4.59 4 2710 1136 41.92 248 9.15 5 3077 700 22.75 236 7.67 6 6215 869 13.98 261 4.20 7 3381 839 24.82 253 7.48 8 4336 830 19.14 267 6.16 Results of the Experiment (XFIG System)
Some Considerations Regarding the Telecommunication System • It is a large legacy system • The traces are generated using an internal mechanism • The traces tend to be incomplete. This is reflected as an inconsistency in the trace with respect to the nesting levels. • Our solution to this problem is to complete the trace • by filling up the gaps with virtual procedure calls • estimate the error ratio, which is the number of missing calls to the size of the original trace. e = g / (g+n)
Trace n g e(%) n1 r1 (%) n2 r2 (%) 1 17465 589 3.37 14396 82.43 2452 14.04 2 11095 313 2.82 9715 87.56 3308 29.82 3 10175 381 3.74 8654 85.05 2361 23.20 4 3621 121 3.34 3226 89.09 694 19.16 5 3609 109 3.02 3281 90.91 1150 31.86 Results of the Experiment (Telecom. System)
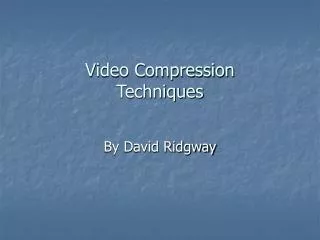
Variation of the degrees of the tree according to depth (3 traces of XFIG) Before the preprocessing step After the preprocessing step
Variation of the degrees of the tree according to depth (3 traces of the telecom. system) After the preprocessing step Before the preprocessing step
Discussion • Procedure-call traces could be considerably compressed in a way that preserves the ability for humans to understand them • Possible improvement • look for procedures that are not of a great interest to software engineers • remove them before the compression process • The preprocessing stage could be very useful to • reduce the trace size • increase of the performance of the common subexpression algorithm
Conclusions and future directions • The results shown in this presentation can help build better tools based on execution traces • We intend to conduct more experiments with this framework to see how helpful it is to software engineers • Future directions should focus on lossy compression.Types of information eliminated can include: • the number of repetitions, the order of calls, and some lower-level utility procedures • The non-contiguous redundancies can be used to determine other features of the system
Trace n n1 r1 (%) n2 r2(%) # Proc. # Files 1 2198 623 28.34 218 9.92 167 30 2 9076 647 7.13 223 2.46 174 31 3 5140 889 17.30 236 4.59 178 30 4 2710 1136 41.92 248 9.15 190 28 5 3077 700 22.75 236 7.67 190 33 6 6215 869 13.98 261 4.20 197 31 7 3381 839 24.82 253 7.48 187 33 8 4336 830 19.14 267 6.16 190 33 Results of the Experiment (XFIG System)With procedures and files
Trace n g e(%) n1 r1 (%) n2 r2 (%) # Proc. # Files 1 17465 589 3.37 14396 82.43 2452 14.04 802 189 2 11095 313 2.82 9715 87.56 3308 29.82 828 184 3 10175 381 3.74 8654 85.05 2361 23.20 876 190 4 3621 121 3.34 3226 89.09 694 19.16 657 160 5 3609 109 3.02 3281 90.91 1150 31.86 668 164 Results of the Experiment (Telecom. System) with procedures and files