Download
1 / 19
190 likes | 406 Views
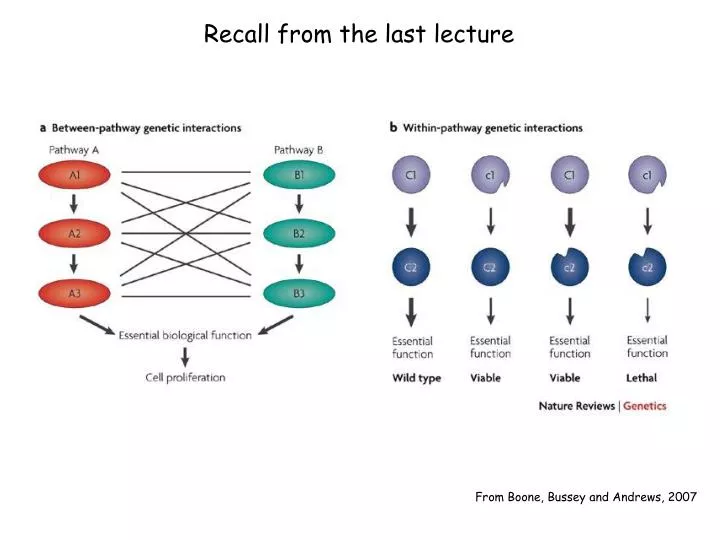
Recall from the last lecture. From Boone, Bussey and Andrews, 2007. Epistasis….infer the order of function. ADE3. ADE1. ADE13. A. B. C. ADENINE. Adenine biosynthesis pathway in yeast cells ade1 mutants are Ade- but are also red because compound B is red

E N D
Recall from the last lecture From Boone, Bussey and Andrews, 2007
Epistasis….infer the order of function ADE3 ADE1 ADE13 A B C ADENINE Adenine biosynthesis pathway in yeast cells ade1 mutants are Ade- but are also red because compound B is red What is the phenotype of the double mutants: ade3 ade1? ade13 ade1? We would say ade3 is epistatic (hides) ade1
Often you don’t have distinguishing phenotypes Example – radiation sensitive mutants YFG1 YFG1 YFG2 or YFG2 Compare single mutants to double mutant
Quantitative analysis of genetic interactions • Mutations can have subtle effects on cells • Suppose mut1 grows a little bit slowly 90% as well as WT • Suppose mut2 also grows a little bit more slowly () • If the genes acted independently, then expect (.8 x .9=.72) 72% as well as WT • Example- Collins et al. Nature 446:806 • “Functional dissection of protein complexes involved in yeast chromosome • biology using a genetic interaction map.” • Choose the genes based on GO Process annotation • Measure the growth rates of all single and double mutant combinations • Can get “aggravating” (synthetic sick) or “alleviating” (suppression) combinations
Design • Choose 754 mutants based on GO annotations • Mostly non-essential but some essential genes mutated as “DAMP” alleles • Essential genes where the 3’ UTR is removed making the mRNA unstable • Hypomorphs • 754 x 754 matrix • Each entry is a number corresponding to a score of how the double mutant • deviated from “expected” assuming the genes functioned independently • Expectation is that if two things are doing the same thing, • they should have the same patterns (and vectors) of interactions • Compare data from protein-protein interaction map (TAP purifications) • Expectation is that proteins in same complex are doing the same thing
1 complex 2 different complexes Additional interactions for blue subunit Identical pattern of interactions except for blue subunit Identical pattern of interactions for all subunits
Chemical-Genetic Profiling • Useful for determining mode of action of a drug • Screen the collection of strains for mutants that are sensitive • Do NOT identify the molecular target in the screen A deletion mutant that is sensitive is missing a protein But the target is still present (that’s why the cells are sensitive) Every strain that is sensitive still has the target Drug Target
Drug MUTATION MUTATION MUTATION Target Buffer Target Buffer SGA Chemical Genomics
Screen for benomyl sensitive strains Represent genes that buffer the effect of the drug YPD Benomyl Sublethal [benomyl] Benomyl-a benzimidazole drug that binds -tubulin (Tub2) and depolymerizes microtubules
Deletion Mutants SGA data + chemical-genetic profiling benomyl
Deletion mutants Microtubule & Spindle Function SGA Queries