Download
1 / 26
260 likes | 364 Views
Productive spillovers of The Takeup of index-based livestock insurance. Russell Toth With Chris Barrett, Rich Bernstein, Pat Clark, Carla Gomes, Shibia Mohamed, Andrew Mude, and Birhanu Taddesse 2014 AAEA Annual Meeting – Minneapolis July 28, 2014.

E N D
Productive spillovers of The Takeup of index-based livestock insurance Russell Toth With Chris Barrett, Rich Bernstein, Pat Clark, Carla Gomes, Shibia Mohamed, Andrew Mude, and BirhanuTaddesse 2014 AAEA Annual Meeting – Minneapolis July 28, 2014
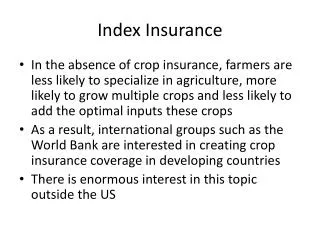
Introduction | Setting | Design | Data | Results | Conclusion • What is the impact of index-based livestock insurance (IBLI) on herd stocking and movement choices of East African pastoralists (livestock herders)? • IBLI could enhance welfare by helping pastoralists smooth shocks to herd stocks due to weather. • Concern that scale-up of IBLI could lead to unsustainable environmental degradation. Main Question
Introduction | Setting | Design | Data | Results | Conclusion • Herd sizes follow boom-and-bust cycles between normal weather and shocks due to drought. • What happens if we introduce weather-indexed insurance that pays out during droughts? Theoretical Possibilities Livestock Drought Drought Time
Introduction | Setting | Design | Data | Results | Conclusion • Herd sizes follow boom-and-bust cycles between normal weather and shocks due to drought. • What happens if we introduce weather-indexed insurance that pays out during droughts? Theoretical Possibilities Livestock Drought Drought Time
Introduction | Setting | Design | Data | Results | Conclusion • Predictions for behavioural response depend on what motivates herd accumulation choices: Precautionary savings? Lack of investment alternatives? • If precautionary savings motives dominate, then IBLI herd size ↓ • If risk-adjusted investment motives dominate, then IBLI could herd size ↑ • Will they feel less need to move (increasing grazing intensity), due to substituting IBLI for self-insurance through costly movement, or perceiving less risk? Or trickle-through effects of herd size – e.g., more vigilant asset protection? Theoretical Possibilities
Introduction | Setting | Design | Data | Results | Conclusion • Predictions for behavioural response depend on what motivates herd accumulation choices: Precautionary savings? Lack of investment alternatives? • If precautionary savings motives dominate, then IBLI herd size ↓ • If risk-adjusted investment motives dominate, then IBLI could herd size ↑ • Will they feel less need to move (increasing grazing intensity), due to substituting IBLI for self-insurance through costly movement, or perceiving less risk? Or trickle-through effects of herd size – e.g., more vigilant asset protection? Theoretical Possibilities
Introduction | Setting | Design | Data | Results | Conclusion • Janzen and Carter (2013): Insured HH with larger asset stocks show less asset decumulation after a drought (in Kenya). • Jensen et al (2014): IBLI leads to decumulation of herd assets (in Kenya). • Cole et el (2013): weather index insurance leads Indian farmers to more risky production choices. Existing Literature is Mixed
Introduction | Setting | Design | Data | Results | Conclusion • Arid and semi-arid rangelands of southern Ethiopia (Borena plateau). • Over 8 million migrant pastoralists in Ethiopia, accounting for significant proportion of agricultural GDP and grazing land. Mobile Pastoralism • Implications for food security and use of otherwise unproductive land.
Introduction | Setting | Design | Data | Results | Conclusion • Bi-annual dry seasons in which local forage and water resources are not enough to sustain most herds. • Hence mobile pastoralists temporarily migrate to remote water points and pastures. • Occupational ladder: sedentarism mobile pastoralism diversification Mobile Pastoralism
Introduction | Setting | Design | Data | Results | Conclusion Mobile Pastoralism
Introduction | Setting | Design | Data | Results | Conclusion Mobile Pastoralism
Introduction | Setting | Design | Data | Results | Conclusion • Every 3-5 years there have been more severe droughts. Mobile Pastoralism <wwalert.wordpress.com> <earthtimes.org> <uk.oneworld.net>
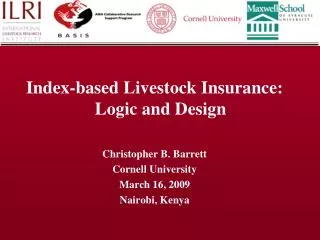
Introduction | Setting | Design | Data | Results | Conclusion • In response to this, colleagues at Cornell, UC Davis and the International Livestock Research Institute (Nairobi, Kenya) began developing an index-based livestock insurance (IBLI) product around 2005, and rolled it out in 2009. • Index-based: uses weather data to detect high probability of herd loss. • Livestock insurance: households can directly insure cattle. Index Insurance (IBLI)
Introduction | Setting | Design | Data | Results | Conclusion • Randomly allocate free IBLI contracts covering 15 cattle, to 10 households (10 control). • Sample stratified to cover 4 segments of herd size distribution (trimming poor, immobile HH and rich ones), in 5 villages. • GPS collar data: • In order to study impacts on movement, track 3 cows per household (so 60 collars in total) using satellite-based GPS collars. • August, 2011 to present (some gaps due to collar issues/failure). • Record exact location at 5 minute intervals. What We Do
Introduction | Setting | Design | Data | Results | Conclusion Data: GPS Collaring
Globular Movement Pattern Each Globule Centered Around a Watering Point. Linear, Trailing Features Several Globules of Concentrated Use High Potential for Environmental Impact Limited Foraging Extent
Very Extensive • Movement Patterns Daily Watering Foraging Much More Dispersed. Foraging Loops Generally Less Impactful.
Introduction | Setting | Design | Data | Results | Conclusion Data: Checking Baseline Balance 1 TLU = 1 adult cow
Introduction | Setting | Design | Data | Results | Conclusion • Use a diff-in-diff estimator on the IBLI randomization: • where indexes households, indexes villages, is an outcome, is an individual-specific fixed effect, and represents other time-varying controls. • Also implement a triple-difference estimator to expose variation along understanding of the IBLI contract (index from 8 questions). Econometric Approach
Introduction | Setting | Design | Data | Results | Conclusion Results: Impacts on Asset Accumulation: TLU cattle IBLI increases herd accumulation by about 11 TLU, about 1/3 of mean herd size and 1/3 of the sd. At baseline: mean(TLU cattle) = 29.3, sd(TLU cattle) = 32
Introduction | Setting | Design | Data | Results | Conclusion Results: Impacts on Asset Accumulation: TLU cattle The mean herd size result does not vary in knowledge of IBLI At baseline: mean(TLU cattle) = 29.3, sd(TLU cattle) = 32
Introduction | Setting | Design | Data | Results | Conclusion Results: Impacts on Max Distance Travelled No significant average effect of IBLI on max distance travelled. At baseline: mean(Max. Dist. Traveled) = 4.2 km, sd(Max. Dist. Traveled) = 3 km
Introduction | Setting | Design | Data | Results | Conclusion Results: Impacts on Max Distance Travelled Max distance decreases by ~1 km (25% of mean) per day per correct question (out of 8) At baseline: mean(Max. Dist. Traveled) = 4.2 km, sd(Max. Dist. Traveled) = 3 km
Introduction | Setting | Design | Data | Results | Conclusion Results: Impacts on Average Speed IBLI increases average speed (economically small effect, 3.1% of mean, 6.7% of sd). At baseline: mean(Avg. Speed) = 0.63 km/hr, sd(Avg. Speed) = 0.3 km/hr
Introduction | Setting | Design | Data | Results | Conclusion Results: Impacts on Average Speed Average speed significantly decreases in knowledge of IBLI (14% of mean, 29% of sd per correct question) At baseline: mean(Avg. Speed) = 0.63 km/hr, sd(Avg. Speed) = 0.3 km/hr
Introduction | Setting | Design | Data | Results | Conclusion • Evidence of an economically-significant impact of IBLI on asset accumulation. • Consistent with fears about excess accumulation. • Interesting interaction in IBLI knowledge – potentially increasing grazing intensity. • Future Work • Richer measures of movement. • More fine-grained analysis (sub-herd level). • Bring in data from large HH survey: • Potential for IV on insurance uptake from larger sample (using cruder movement data on large HH survey). Conclusion and Discussion