Download
1 / 29
290 likes | 445 Views
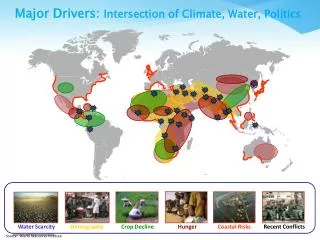
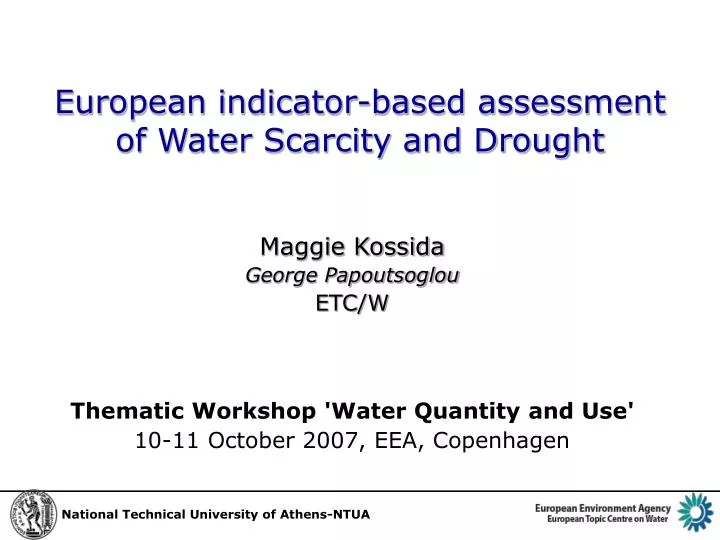
European indicator-based assessment of Water Scarcity and Drought. Maggie Kossida George Papoutsoglou ETC/W Thematic Workshop 'Water Quantity and Use' 10-11 October 2007, EEA, Copenhagen. National Technical University of Athens-NTUA. EU Drought Facts.

E N D
European indicator-based assessment of Water Scarcity and Drought Maggie Kossida George Papoutsoglou ETC/W Thematic Workshop 'Water Quantity and Use' 10-11 October 2007, EEA, Copenhagen National Technical University of Athens-NTUA
EU Drought Facts increase in annual average EU territory (from 6% to 13%) and population (from 6% to 13%) affected by droughts between the 1976-1990 period &1991-2006 WS & Droughts 2nd Interim report, June 2007, DG ENV
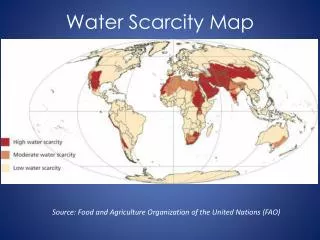
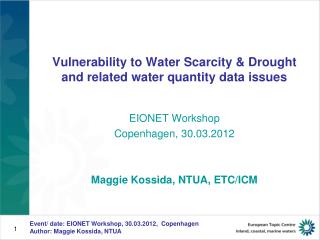
Population exposed to drought events in Europe 2007-04 (UNEP) Areas of water surplus and deficit Spanish NationalHydrological Plan 2007-04 (UNEP)
Overall economic impacts of drought events in the past 30 years: 100 billion € at EU level The annual average impact doubled between the 1976-1990 period and the next 1991-2006 Up to 6.2 billion €/year in the most recent years, exceptional cost of 8.7 billion € in 2003. only cover economic costs are covered (social & environmental costs not included) WS & Droughts 2nd Interim report, June 2007, DG ENV
EU Commission Communication Water Scarcity and Drought Communication 18th July Communication from the COM to the EU Parliament & the Council addressing the challenge of WS & drought in the EU {SEC(2007)993}{SEC(2007)996} 2.3.1. Developing drought risk management plans 2.3.2. Developing an observatory and an early warning system on droughts 2.7.1. A water scarcity and drought information system throughout Europe The issue: reliable info is indispensable for decision-making, shared definitions are necessary, WISE provides the ideal platform to integrate and disseminate such information Way forward: present an annual EU assessment, based on agreed indicators and data provided by MS and stakeholders to the COM or EEA on a yearly basis
EEA WS&D Activities ETC/W+ ETC/LUSE • A. Assessment of ongoing activities and Gap Analysis • main institutional/organisational and knowledge related problems in tackling WS&D problems • further needs and development of both a European Drought Observatory and a WS&D information System B. Development of a coherent WS&D indicator System (WSDIndiS) as central part of the information network
EEA WS&D Activities • C. Networking Activities • setting up a core network (EEA/ETC, JRC, DG, experts) • setting up of a wider network (MS representatives, RBD authorities etc.) for consultation on the activities, dissemination etc. • enhance EU internal and international information exchange in a well accessible information platform • D. Defining the framework of a Drought Observation& Information Network • definition and outline of DOINet • next steps to be taken on all institutional and organizational levels
Towards a WSDIndiS The issues: • diverse geographical and temporal distribution • wide variety of disciplines affected • many scales on which drought operates on • make it difficult to develop an index to measure it • Rather a WS & Drought Indicator System (WSDIS) • could nicely fit into the WISE platform • define appropriate level of disaggregation • stepwise approach, start w/selected pilot RBDs/RBs ~ data availability (WEI_reg) • evaluate adequate triggers & thresholds • follow the DPSIR framework • may also refer to the US Experimental Objective Blends of Drought Indicators • establishment of a stable data flow to ensure maintenance of the indicator set
Pressure Response Driving Force State Impact DPSIR Indicator framework for WS&D Precipitation ClimateChange Precipitation deficit Natural factors Evapotranspiration Ecological minimum flow Temperature Water Exploitation Index WEI Implementation of DMPs Population density Reservoir storage Water efficiency Water use per sector River discharge Investment supply/demand side measures GW/aquifer level Man-made factors Irrigation Loss of wetlands Tourism Water price Salt water intrusion Water restrictions
10 Replies:CY, DE, ES, FI, FR, IT, NL, PT, SI, UK Thank you ! Outline Questionnaire on WS&D Main Objective:collect information, focusing on existing available products and indicators used for identifying, assessing and managing these phenomena.serve as a basis of grouping the retrieved information towards a broader assessment for better sustaining and coordinating the development of indicators on WS&D Structure:Table 1 General info on respondentTable 2 General info on D&WS information productsTable 3 Drought indicators used in the Member country/StateTable 4 WS indicators used in the Member country/State
Drought Meteorological Indicators 10 Replies Mediterranean: CY, ES, FR, IT, PT Northern: DE, FI, NL, SI, UK
Drought Impact Indicators ES, FR, PT, NL, UK * Economic impacts: Damage in agriculture, nature, navigation, tourism using models simulations * Environmental impacts: Mainly wetlands, aquifers and vulnerable areas, Fishes index * Impacts on society: Water quality controls for public supply
Drought Adapt & Mitig. Indicators ES, FR, UK * Spring trades for summer restrictions * Comprehensive system of drought plans. Water Resources Strategy used in Northern Ireland * Long-term water resources plans and strategies consider drought. Temporary pipeline/pumping of potable water if required in Northern Ireland
WS_water availability Indicators * potential water availability * water Deficits (surface and groundwater). Based on models simulations that combine hydrological effects with sector damages
WS multi-component Indicators ES, NL, UK * water Deficits (surface/water supply deficit, and groundwater/soil moisture deficit). Based on models simulations that combine hydrological effects with sector damages on agriculture, nature, navigation and tourism
WS_env. impacts Indicators * Indicators describing indirectly ecological impacts (on habitats, fish, birds) * Environmental incidents (fish mortalities, algal blooms)
WS_other impacts Indicators ES, DE, FI * Hydropower production ** Length of the period when water level adequate for recreational use
WS Mitig.&Adapt. Indicators *productivity of water (measured as the gross domestic product / water used) Economic instruments: e.g. Water markets, Water supply priority series
Remarks Most common variables -Drought Precipitation Reservoir Storage Streamflow Groundwater level Soil moisture Most common parameters -WS Water balance Water Abstractions Most common Impacts parameters Environmental Impacts Economic Impacts
WEI Regionalization based on the Test Data Exchange 2008
Modified WEI_regional per administrative region: FW Abstractions / Internal Flow Note: ExIn = 30,000 mainly in Rhone-Alpes need for RBD/RB scale
Modified WEI_regional: FW Abstractions / Renewable water resources 2006 Slovak Republic Latvia
WSDIndiS Stable Data Flow The Test Data Exchange 2008 served as a first step in: • streamlining the reporting on the “State & quantity of water resources” • identifying the countries’ reporting resources and capabilities • opening the discussion towards common definitions and harmonisation of the reported parameters • developing a user friendly reporting template/format for the Rep.Sheet#3 With the overall purpose of: • establishing a stable data flow on water availability & abstractions under WISE • bridging the data gaps & data uncertainty in estimating water availability and water abstraction (EU Communication 18/07/07) • supporting the development of WS&D indicators under the DPSIR framework w/proper level of disaggregation • enhancing reliable in depth State of Environment assessments
Update • So far: • Results from questionnaire – identification of first key parameters & most commonly used indicators - Presented to Core Group for feedback. • Presentation of the DSPIR framework – feedback – refinement. • Test Data Exchange 2008 templates sent out for filling – first assessment presented. • Cross gap analysis in progress • Analysis of the data exchange and possibilities for a streamlined regular data flow (in progress). • Water Quantity workshop (June 11th) - outputs to feed into the Indicators’ development process • First draft of Indicators to be presented in the SCG ~ October 2008 Thank you for your attention!