Download
1 / 70
1.43k likes | 3.27k Views
BALANCE OF PAYMENTS. BOP or Balance of International Payments is the systematic and summary record of a country’s economic and financial transactions with the rest of the world over a period of time. As per IMF:

E N D
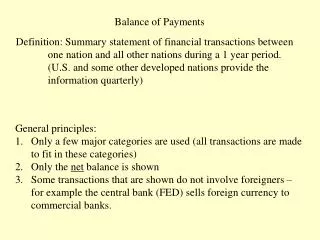
BALANCE OF PAYMENTS BOP or Balance of International Payments is the systematic and summary record of a country’s economic and financial transactions with the rest of the world over a period of time.
As per IMF: BOP is a statistical statement for a given period showing: (a) transactions in goods & services and income between an economy and the rest of the world; (b) changes of ownership and other changes in that country’s monetary gold, SDRs, and claims on and liabilities to the rest of the world; and (c) unrequited transfers and counterpart entries that are needed to balance, in the accounting sense any entries for the foregoing transactions and changes which are not mutually offsetting. – IMF, Balance of Payments Manual.
Difference between BOP and BOT Balance of Trade: only exports and imports of merchandise or goods , i.e. only visibles. • Hence does not show the services (shipping, insurance, payment of interest, royalties, tourist spendings, etc.) BOP: both visibles and invisibles.
Nature of BOP accounting • Follows double entry book keeping system. • Each transaction has a debit and credit • Has to balance (if not : errors & omissions entry)
Components of BOP Various entries grouped under 4 categories or accounts (parts) • A) Current Account • B) Capital Account • C) Unilateral Payments Account • D) Official Settlements Account.
Components of BOP Balance of payment (BoP) comprises: • current account, • capital account, • errors and omissions and • changes in foreign exchange reserves.
Current Account • Is a summary record of a nation’s goods and invisibles transactions with the rest of the world. • All transactions which give rise to or use up National Income. • Includes 2 major items: Merchandise exports & imports Invisible exports & imports • Exports = credit entry ( i.e. claims on foreigners) • Imports = debit entry (i.e.claims on home country)
Invisibles • Invisibles include: a. non factor services: –travel, transportation, insurance, Government not included elsewhere (GNIE) and miscellaneous, (which includes communication, construction, financial, software, news agency, royalties, management and business services) b.income c.private transfers ( NRI remittances, gifts ) and official transfers (Grants) ( for which no quid pro quo) • Non Factor Services include: • export of software services • travel and transportation (tourist spending, shipping etc,)
Current account balance • Current account balance is synonymous with net foreign investment. • A current account surplus means that: • The country has positive net foreign investment (i.e., the country is acting as a net lender to or investor in the rest of the world). • The country is producing more ( and has more income from this production) than it is spending on goods and services. • such a country is saving more than it is investing domestically • Adeficit = the nation is a net borrower or domestic savings are less than domestic investment.
Capital Account • Shows the capital inflows and outflows. • =Claims and liabilities which go to finance the deficit on current a/c or absorb its surplus. • Short Term • Long Term • Capital Outflow = Debit ( eg. Indian inv in a foreign country, inv in foreign securities, govt.loans to foreign countries) • Capital Inflow = Credit ( FDI by a foreign co. in India, loans to Govt. from foreign countries, NRI deposits). • Also ST investments from abroad (incl FIIs).
The interest on loans and dividends/profits received are current account; • while the loan and FDI are capital account transactions.
Capital Account components • Capital inflows can be classified by instrument (debt or equity) and maturity (short or long term). • The main components of capital account include foreign investment, loans and banking capital. • Foreign investment comprising foreign direct investment (FDI) and portfolio investment represents non-debt liabilities, while loans (external assistance, external commercial borrowings and trade credit) and banking capital including non-resident Indian (NRI) deposits are debt liabilities.
Unilateral Transfer Account • = Gifts. No quid pro quo. • One-sided transactions • Include private remittances, govt grants, pension payments, disaster relief, etc. • If received = credit; if paid = debit • Now included in Other Receipts.
Official Settlement Account • =Monetary Movement • Official reserves represent the holdings by the Government (or official agencies) of the means of payment that are generally accepted for the settlement of international claims.
Causes of BOPdisequilibrium • Disequilibrium = there is surplus or deficit in BOP • Deficit = demand for forex exceeds the supply • Reasons: • Economic factors • Political factors • Sociological factors
Economic factors • Development Disequilibrium: Large scale development expenditure = increase in purchasing power + increase in demand & prices. --Leads to huge imports (also of Capital Goods) --Hence adverse BOT adverse BOP.
2. Capital Disequilibrium • Due to cyclical fluctuations in general business activity. • If domestic economy experiences a boom, while the rest of the world not so --then more purchasing power & demand and higher prices --hence more imports • But exports difficult because of slackness in world economy. • Hence……
3. Secular Disequilibrium • If long term BOP problem, then it is due to some secular trends in the economy. • If domestically: persistent high demand and high domestic prices (eg.USA) then imports will always be more than exports. • ( if high production costs locally: but high disposable incomes and hence very high aggregate demand and high prices….)
4.Structural Disequilibrium Affects exports & imports • Because of development of alternative sources of supply, • discovery of better substitutes, • exhaustion of productive resources, • changes in transport routes and costs etc.
II. Political factors • Continuous political instability, wars, etc., will lead to capital outflows and inadequacy of domestic investment and production • Hence BOP problems.
III. Social factors • Changes in tastes, preferences, fashions etc., will affect the exports and imports. • Hence BOP…
Correction of Disequilibrium • Automatic Correction & Deliberate Measures • Automatic: If adverse BOP fall in the external value of the domestic currency --So, exports will become cheaper and imports will become costlier --this will restore …
Deliberate Measures • Monetary Measures: a) Contraction in money supply —will reduce purchasing powerreduce demand -- so less imports b) fall in prices cheaper—so more exports
Devaluation • Exports cheaper and imports costlier • E.g.: 1966 June: 4.76 to 7.50
Exchange control • To conserve forex • Only through ADs • Central Bank
Trade Measures • Export incentives • High import duties and restrictions • Canalisation
Other Measures • Getting foreign loans • Foreign assistance, Aid… • Development of tourism • Export of services, BPOs, ITES, etc.
BOP: INDIA • Because of the trade deficit, India has had BOP deficits in most of the years • Though its effect has been mitigated to a great extent by invisible surplus. • But this problem has increased the country’s dependence on external capital markets and increased its vulnerability to external shocks.
During the I FYP: no BOP problem because of the huge sterling balances India had at the time of independence. • In 1950-51: our forex reserves were equal to 158% of our merchandise imports. • But by 1957-58 the reserves came down to about 1/3 of the level in 50-51 and resulted in shortage. • So, we got aid from Aid India Consortium and drawals from IMF.—also stringent import controls started. • 1966 Re was devalued : to improve exports
In 1972-73: we had a trade surplus of Rs.104 cr. • But then came the I Oil Shock: 4 fold increase in international crude prices between Sept1973 and April, 74. • But we managed somehow this and during 1976-77 to 1979-80: an improvement in BOP. • In 1976-77, there was even a small trade surplus of Rs.72 cr. • But the main reason for the improvement in BOP was the sharp increase in inflow of remittances from our emigrant workers,esp from Gulf.
But then came the II Oil Shock in 1979-80: trade deficit shot up from Rs 2200cr in 78-79 to Rs 6,200 cr in 1980-81. • Also a gradual decline in net receipts from invisibles, while the trade deficit widened. • An important reason for the BOP problem in 1980s and since then is the change in source of financing the large current a/c deficit. --Until the beginning of the 80’s; almost the entire deficit was financed thru inflows of concessional assistance (hence, debt-service burden low) --this was drastically replaced by commercial debt—to pvt creditors, incl com banks and NRIs
Invisible surpluses have traditionally financed a large part of India’s trade deficits --but there was a steep fall in this since 80’s. • In 1980-81: net invisibles financed nearly 73% of trade deficit. • During 6th Plan(1980-85): it was on an average > 60%. • But by 1990-91: it dropped to about 13% only. • Hence, was forced to go for external (commercial) sources to meet our payments obligations—crisis….pledging gold….
Made worse by the falling trend in net invisibles • Why: Rise in invisibles payments: due to rising interest and service payments on foreign loans & credits. -- In 1990-91, the Debt service ratio was 35.3%. In 2000-01, it was 17.3% (now ,2004-05, only around 6.2%).
Liberalisation and after With the ec liberalisation: improvement • Marked improvement in the coverage ratio i.e. ratio of export bill to import bill • And inflow of invisibles • In 1990-91 it was only 2.5 months (bare minimum norm =3 months of import). In July 1991 only 15 days ! • now (‘04-05) more than 14.3 months. (in ‘03-04, it was 16.9) • As a result, there was surplus in the Capital a/c of BOP (esp. during 1996-97 to 1998-99) • So, comfortable BOP • The debt creating flows as % of total capital flows which averaged 97% during the 7thPlan(85-90) declined to less than 18% by 94-95.
Recent Trends • The year 2001- 02, which recorded a current account surplus for the first time in 23 years, is a landmark year in the history of the BOP of India. • This resulted from the vibrant trends in respect of the invisibles over the past one decade or so.
However… • After 3 years of surplus, the current a/c reverted to the previous situation with a deficit or $5.4 bn in 2004-05. • This was caused by a 147% increase in merchandise trade deficit which far outstripped the increase in invisible surplus. • and continues to be in deficit.
Remittances • Emigrant remittances, the single most important source of India's invisible earnings for long, exhibited a robust growth, registering a more than 6-fold growth from $ 2 billion at the start of 1990s to almost $ 13 billion by 2000-01, forming 2.7 per cent of GDP. • Following the heavy inflow of invisible receipts, India’s Current a/c deficit narrowed down during the 90’s and the nation enjoyed a current a/c surplus in 2001-02 when the merchandise deficit of $12.7bn was more than offset by the invisible surplus of over $14bn. • Similarly, in 02, and 03.
India continues to remain the highest remittance receiving country in the world. • In 2004, inward remittances into India were US$21.7 billion. (3% of our GDP) • This made India thehighest remittance receiving country in the world, followed by China (US$21.3 billion), Mexico (US$18.1billion), France (US$12.7 billion) and Philippines (US$11.6 billion). • India’s share in total global remittancesof $225.8 billion in 2004, was almost 10 %. (Global Economic Prospects, 2006; World Bank). • In 2007, India received $27bn (out of a total of $318 bn)—as per World Bank’s Migration and Remittances Fact Book, 2008.
Paradigm shift in services trade • While the period up to the 1980s was dominated by tourism earnings, the second half of the 1990s witnessed an unprecedented jump in India's earnings from newer activities like software service exports and other IT-related skill-intensive exports. • Software services have shown spectacular growth while also emerging as the most important source of miscellaneous services earnings, increasing from $ 0.3 billion in 1993-94 to $ 7.2 billion in 2001-02, with its share rising from less than 3 % to over 20 % of total invisibles receipts during this period.
The growth in receipts from information and communication related services (services relating to computer software, hardware, internet, e-commerce and telecommunication sector) experienced over the last decade was unprecedented. • Theratio of invisible earnings to merchandiseincreased from 40 % in 1990-91 to almost 75 % in recent years reflecting the shifting comparative advantage of India in favour of services.
With the shift in the competitiveness towards services, in particular the technology related services, India has emerged as one of the fastest growing exporters of services in the world. • Reflecting this, gross invisible receipts (comprising services, transfers and income) increased from 29 %of total current receipts in 1990-91 to 44 % of total current receipts in 2001-02. • Net invisible surplus grew by 35.2 per cent to reach US$ 31.7 billion in 2007-08 (April-September), equivalent of 6.1 per cent of GDP.
Capital Account • The substantial increase in the foreign investment, as a result of the liberalization has been generating significant capital account surplus. • Capital account surplus increased from less than $ 4 billion during the 1980s to US $ 8.6 billion during 1992-2002, resulting in a huge a accumulation of foreign exchange reserves. • As a proportion of GDP, capital flows increased from 1.6 per cent during 1980s to 2.3 per cent during 1992-2002 and now it is around 2%.
The trends in the capital flows over the 1990s reflects a shift in importance from debt to non-debt flows with the declining importance of external assistance and external commercial borrowings (ECBs) and the increased share of foreign investment - both direct and portfolio. • FDI inflows (net) was $4.7 bn in 05-06 and of this 75.2% was in equity.
The increase in capital inflows coupled with the improvement in the current account position resulted in a surplus in the overall BOP of India from 1993-94 onwards, excepting 1995-96. • The surplus amounted to $ 26.2 billion in 2004-05 as against a deficit of US $ 0.6 billion in 1992-93. • As a result India is one of the largest reserve-holding economies of the world.
Causes of BOP problem in India • 1. Large trade deficit • 2. Fall in invisible surplus, caused by a) increase in invisibles payments (debt service) b) slackening of emigrants’ remittances and travel income. • 3. Sensitive behaviour of foreign creditors and NRIs • 4. Declining role of concessional external finance.
2009-2010 • BoP developments during 2009-10 indicate that despite lower trade deficit, current account deficit widened on account of slowdown in invisible receipts. • There was also sharp increase in capital flows, which led to accretion in foreign exchange reserves. • The current account deficit of 2.8 % of the GDP in 2009-10 vis-a-vis 2.3 % in 2008-09, however remained well within manageable limits. • The net capital flows increased substantially to 3.8 % of GDP in 2009-10 as compared to 0.5 % in 2008-09. • This led to net accretion of US$ 13.4 billion in foreign exchange reserves on BoP basis, as against the net outflow of US$ 20.1 billion in 2008-09.
2009-10 • Major determinants of BoP transactions such as external demand, international oil and commodity prices, pattern of capital flows and the exchange rate changed significantly during the course of the year. • With the turnaround in exports and revival in capital flows, external sector concerns receded gradually in the second half of 2009-10.
First half (H1 – April-September 2010) of 2010-11 • As per the latest data available, the highlights of BoP developments during the first half (H1 – April-September 2010) of 2010-11 were higher trade and current account deficits as well as capital flows visa-vis the first half of 2009-10.