Download
1 / 5
50 likes | 173 Views
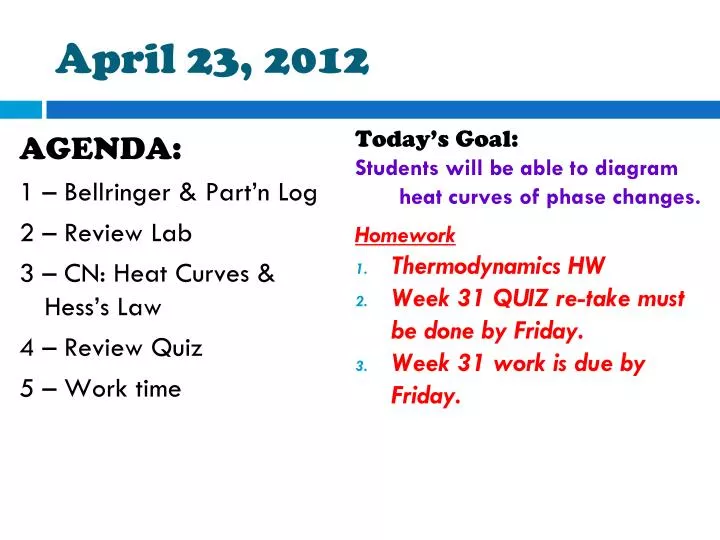
April 23, 2012. AGENDA: 1 – Bellringer & Part’n Log 2 – Review Lab 3 – CN: Heat Curves & Hess’s Law 4 – Review Quiz 5 – Work time. Today’s Goal: Students will be able to diagram heat curves of phase changes. Homework Thermodynamics HW Week 31 QUIZ re-take must be done by Friday.

E N D
April 23, 2012 AGENDA: 1 – Bellringer & Part’n Log 2 – Review Lab 3 – CN: Heat Curves & Hess’s Law 4 – Review Quiz 5 – Work time Today’s Goal: Students will be able to diagram heat curves of phase changes. Homework • Thermodynamics HW • Week 31 QUIZ re-take must be done by Friday. • Week 31 work is due by Friday.
Explain how heat curves show phase changes. • Topic:Heat Curves & Hess’s Law • Date:4/23/2012 • Phase change = physical change = same material, different state of matter • Water: freezes at 0°C, boils at 100°C gas Phase change= no temperature change boiling / condensing liquid solid melting / freezing
Cornell Notes (continued) Trace the steps of how to draw a reaction coordinate diagram. A chemical reaction had reactants with 200J of energy. To get the reaction started, 600J of energy were added. Then 700J of energy are released to form the products. Activation Energy (600J) = energy needed to make the reaction happen spontaneously ∆H = HP – HR ∆H = 100J – 200J ∆H = -100J exothermic R P ∆H
Example: Graph to Description The reactants had J of energy. An activation energy of J was required. The products then had J of energy. Overall, the reaction was thermic. 300 P 400 R 500 endo ∆H = HP – HR ∆H = 500J – 300J ∆H = + 200J endothermic
Example: Graph to Description The reactants had J of energy. An activation energy of J was required. The products then had J of energy. Overall, the reaction was thermic. 350 R 50 P 100 exo ∆H = HP – HR ∆H = 100J – 350J ∆H = - 250J exothermic