Download
1 / 11
110 likes | 222 Views
Project STAR contributes to the harmonisation of river classification methods, comparing national assessment approaches and developing common metrics. The study involves bilateral comparisons using existing data to identify differences in quality class assignment, leading to a conversion formula. The project aims to create a benchmark dataset for harmonising national classification schemes using shared metrics.

E N D
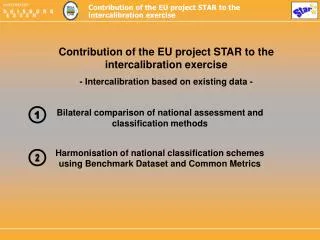
1 2 Contribution of the EU project STAR to the intercalibration exercise - Intercalibration based on existing data - Bilateral comparison of national assessment and classification methods Harmonisation of national classification schemes using Benchmark Dataset and Common Metrics
1 Bilateral comparison of national assessment and classification methods Classical approach of method comparison (Tittizer 1975, Nixon et al.1996) 1. Correlating results of two national assessment methods →conversion formula (adjustment factor) 2. National classification →Identifying differences in quality class assignment 3. Matrix of possible bilateral comparisons within a GIG
EXAMPLE • > 80 samples • Intercalibration type: R-C4 „medium lowland rivers, mixed g.“ • countries: Denmark, Germany, Sweden, United Kingdom • Biological Quality Element: Benthic Invertebrates • Assessment methods: • Saprobic Index (DE) • Danish Stream Fauna Index (DK, SE) • Average Score Per Taxon (UK, SE) • national classification systems • and • national reference values to calculate EQRs
EXAMPLE equal: 48 samples SI (DE) higher:30 samples DSFI (DK) higher:5 samples R - C4 medium, lowland, mixed n = 83, rs = 0.80 Saprobic Index (DE) - Danish Stream Fauna Index (DK)
EXAMPLE R - C4 medium, lowland, mixed n = 83, rs = 0.80 Saprobic Index (DE) - Danish Stream Fauna Index (SE)
EXAMPLE R - C4 medium, lowland, mixed n = 83, r = 0.81 Saprobic Index (DE) - Average Score Per Taxon (SE)
EXAMPLE R - C4 medium, lowland, mixed n = 83, r = 0.81 Saprobic Index (DE) - Average Score Per Taxon (UK)
R - C4 medium, lowland, mixed Share of quality classes per method (n = 83)
EQR = national reference value SI (DE) ASPT (UK) ASPT (SE) DSFI (DK) DSFI (SE) comparison of national reference values average index value of all 83 samples
observed > 1 expected EQR per method (n = 83) R - C4 medium, lowland, mixed
Each sample provides: • detailed information on BQE and abiotic data • resulting from different river types within a GIG (normalisation via EQRs) • →quality classification (1 to 5) of each sample based on Best Available Classification Benchmark dataset Test dataset 2 Samples of the national monitoring program (different field techniques, identification level etc.) →quality classification (1 to 5) of each sample based on National Assessment and Classification Method common metrics Harmonisation of national classification schemes using benchmark dataset and common metrics • metrics, that • indicate man-made stress in different habitats (=types) • deliver comparable and reliable results using data on different quality-basis • →combined to Common Multimetric Index COMPARISON: Range of results of Common Multimetric Index per Quality Class