Download
1 / 72
720 likes | 859 Views
Source: 2003 National Conference for Agribusiness, “Serving Commercial Producers: Meeting Needs, Adding Value” Center for Food and Agricultural Business. The 2003 National Conference for Agribusiness. Serving Commercial Producers: Meeting Needs, Adding Value

E N D
Source: 2003 National Conference for Agribusiness, “Serving Commercial Producers: Meeting Needs, Adding Value” Center for Food and Agricultural Business The 2003 National Conference for Agribusiness Serving Commercial Producers: Meeting Needs, Adding Value Center for Food and Agricultural Business
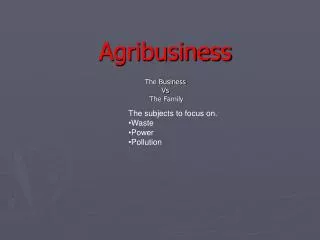
Source: 2003 National Conference for Agribusiness, “Serving Commercial Producers: Meeting Needs, Adding Value” Center for Food and Agricultural Business Successful agribusinesses recognize the importance of thoroughly understanding their customer’s business Staying ahead of an industry that is evolving at a breakneck pace is no easy task
Source: 2003 National Conference for Agribusiness, “Serving Commercial Producers: Meeting Needs, Adding Value” Center for Food and Agricultural Business As the agricultural production landscape changes, so do the needs of the commercial producers in that landscape. Anticipating the needs of today’s and tomorrow’s producer can position your firm to be the the producer’s partners of choice.
Source: 2003 National Conference for Agribusiness, “Serving Commercial Producers: Meeting Needs, Adding Value” Center for Food and Agricultural Business The Commercial Producer Survey In January, Purdue University and its partners began a project to: • Provide a comprehensive profile of commercial farming operations • To better understand the decision-making processes of commercial producers • To assess what the findings imply for the marketing strategies of input suppliers • Compare the results to the ’93 and ’98 Commercial Producer Survey
Source: 2003 National Conference for Agribusiness, “Serving Commercial Producers: Meeting Needs, Adding Value” Center for Food and Agricultural Business The Conference Results from the 2003 Commercial Producer Survey are the driver of this conference’s themes:
Source: 2003 National Conference for Agribusiness, “Serving Commercial Producers: Meeting Needs, Adding Value” Center for Food and Agricultural Business Conference Themes Reconfiguring the Value Bundle Christine Wilson and Corinne Alexander with… • Doug Bowman- Emory University, GA • Chip Donahue – Brandt Consolidated, IL Focus … Product, service, and information in the value bundle and the implications for market segmentation, targeted marketing and branding
Source: 2003 National Conference for Agribusiness, “Serving Commercial Producers: Meeting Needs, Adding Value” Center for Food and Agricultural Business Conference Themes Serving the Next Level Michael Boehlje with… • Ken Doyle, Farmer, IL • Scott Fullen, Farmer, TN • Ben Riensche, Farmer, IA Focus Meeting the needs of the large producer
Source: 2003 National Conference for Agribusiness, “Serving Commercial Producers: Meeting Needs, Adding Value” Center for Food and Agricultural Business Conference Themes Serving Multiple Market Segments Joan Fulton and Scott Downey with … • Andrew Miller, Weaver Popcorn, IN • Jeff Simmons, Elanco, IN • Tim Kavanaugh, Federated Coops, MN Focus … Serving the midsize, commercial, and large producer at the same time
Source: 2003 National Conference for Agribusiness, “Serving Commercial Producers: Meeting Needs, Adding Value” Center for Food and Agricultural Business Conference Themes Selling Key Accounts Dave Downey with … • Rodney Green, Ravensdown Fertiliser, Christchurch, NZ Focus … Positioning our sales force to deliver value and create a relationship with key commercial producers
Source: 2003 National Conference for Agribusiness, “Serving Commercial Producers: Meeting Needs, Adding Value” Center for Food and Agricultural Business Conference Themes Keynote Speakers • Steve Bishop, Procter and Gamble Growing Profits in “Mature” Markets: Lessons from Procter and Gamble • Doug Devries, John Deere Adding Value for Commercial Producers: A Vision for the Future
Source: 2003 National Conference for Agribusiness, “Serving Commercial Producers: Meeting Needs, Adding Value” Center for Food and Agricultural Business The 2003 Commercial Producer Survey The Changing Characteristics of Commercial Producers
Source: 2003 National Conference for Agribusiness, “Serving Commercial Producers: Meeting Needs, Adding Value” Center for Food and Agricultural Business Consortium Members • Agrium Incorporated • Dow AgroSciences • Farm Journal • Monsanto Company • Pioneer Hi-Bred
Source: 2003 National Conference for Agribusiness, “Serving Commercial Producers: Meeting Needs, Adding Value” Center for Food and Agricultural Business Study Design • 14,301 Questionnaires ……mailed January 2003 • Names from Farm Journal • Producers in states accounting for 75% of production (by enterprise) • Corn/Soybeans, Wheat/Barley/Canola, and Cotton • Dairy, Swine, Beef • Fruits/Nuts/Vegetables/Vines
Source: 2003 National Conference for Agribusiness, “Serving Commercial Producers: Meeting Needs, Adding Value” Center for Food and Agricultural Business Study Design • Targeted producers with greater than $100,000 in sales in at least one enterprise • Special focus on producers with greater than $500,000 in sales in at least one enterprise
Source: 2003 National Conference for Agribusiness, “Serving Commercial Producers: Meeting Needs, Adding Value” Center for Food and Agricultural Business Number of Respondents by Primary Operation
Source: 2003 National Conference for Agribusiness, “Serving Commercial Producers: Meeting Needs, Adding Value” Center for Food and Agricultural Business Commercial Corn/Soybean Producers 9% 11% 4% 13% 4% 8% 13% 12% 5% 5% 6% Total: 356 Other States: 11%
Source: 2003 National Conference for Agribusiness, “Serving Commercial Producers: Meeting Needs, Adding Value” Center for Food and Agricultural Business Commercial Wheat/Barley/Canola Producers 18% 23% 32% 2% 7% 2% 7% 7% Total: 41 Other States: 2%
Source: 2003 National Conference for Agribusiness, “Serving Commercial Producers: Meeting Needs, Adding Value” Center for Food and Agricultural Business Commercial Cotton Producers 6% 6% 6% 14% 63% 3% Total: 129 Other States: 2%
Source: 2003 National Conference for Agribusiness, “Serving Commercial Producers: Meeting Needs, Adding Value” Center for Food and Agricultural Business Commercial Dairy Producers 4% 8% 11% 20% 4% 4% 8% 3% 4% 21% 2% 2% Total: 266 Other States: 9%
Source: 2003 National Conference for Agribusiness, “Serving Commercial Producers: Meeting Needs, Adding Value” Center for Food and Agricultural Business Commercial Pork Producers 15% 6% 23% 5% 6% 4% 5% 6% 17% 4% Total: 191 Other States: 9%
Source: 2003 National Conference for Agribusiness, “Serving Commercial Producers: Meeting Needs, Adding Value” Center for Food and Agricultural Business Commercial Beef Producers 7% 4% 4% 2% 2% 1% 7% 7% 7% 1% 4% 19% 10% 2% 19% Total: 103 Other States: 5%
Source: 2003 National Conference for Agribusiness, “Serving Commercial Producers: Meeting Needs, Adding Value” Center for Food and Agricultural Business Fruit, Nut, Vine and Vegetable Growers 15% 1% 4% 5% 8% 5% 5% 37% 1% 1% 2% 8% Total: 169 Other States: 8%
Source: 2003 National Conference for Agribusiness, “Serving Commercial Producers: Meeting Needs, Adding Value” Center for Food and Agricultural Business The Commercial Producer Study Allan Gray Focus … Who are the producers and what are their plans?
Source: 2003 National Conference for Agribusiness, “Serving Commercial Producers: Meeting Needs, Adding Value” Center for Food and Agricultural Business Defining Enterprise Sizes • Respondents defined as “Mid-Size” or “Commercial” based on calculated revenues • Mid-Size • Sales in one enterprise of $100K-$499K • Commercial • Sales in one enterprise of $500K plus • Commercial-T (“Typical” commercial producer) • Majority of the Commercial segment • Large • Top 15% of respondents in Commercial enterprise segment
Source: 2003 National Conference for Agribusiness, “Serving Commercial Producers: Meeting Needs, Adding Value” Center for Food and Agricultural Business Physical Units Defining Mid-Size, Commercial, and Large Crop Enterprises
Source: 2003 National Conference for Agribusiness, “Serving Commercial Producers: Meeting Needs, Adding Value” Center for Food and Agricultural Business Physical Units Defining Mid-Size, Commercial, and Large Livestock Enterprises
Source: 2003 National Conference for Agribusiness, “Serving Commercial Producers: Meeting Needs, Adding Value” Center for Food and Agricultural Business Average Size of Crop Operations
Source: 2003 National Conference for Agribusiness, “Serving Commercial Producers: Meeting Needs, Adding Value” Center for Food and Agricultural Business Average Size of Livestock Operations
Source: 2003 National Conference for Agribusiness, “Serving Commercial Producers: Meeting Needs, Adding Value” Center for Food and Agricultural Business Characteristics
Source: 2003 National Conference for Agribusiness, “Serving Commercial Producers: Meeting Needs, Adding Value” Center for Food and Agricultural Business Participant Demographics I • 97% of Commercial respondents are male • 90% of Commercial respondents are the primary decision-maker • 32% of Commercial respondents are college graduates • 29% of Commercial respondents are high school graduates
Source: 2003 National Conference for Agribusiness, “Serving Commercial Producers: Meeting Needs, Adding Value” Center for Food and Agricultural Business Participant Demographics II • 33% of Commercial respondents are in 45-54 year age group • 33% under 44 years of age • 14% under 35 years of age • Cotton and wheat/barley producers fewer Under 35 • Swine and corn/soybean producers younger, more in Under 35
Source: 2003 National Conference for Agribusiness, “Serving Commercial Producers: Meeting Needs, Adding Value” Center for Food and Agricultural Business Respondent’s Age by Size Significantly different at p<.05
Source: 2003 National Conference for Agribusiness, “Serving Commercial Producers: Meeting Needs, Adding Value” Center for Food and Agricultural Business Farm Operation General Attitudes
Source: 2003 National Conference for Agribusiness, “Serving Commercial Producers: Meeting Needs, Adding Value” Center for Food and Agricultural Business General Attitude Questions • I consider myself successful • I am very confident in my own ability • Farming is one of the best jobs on earth • Other producers often ask my opinion about new products • I am achieving most of my goals • I am very optimistic about the future of farming
Source: 2003 National Conference for Agribusiness, “Serving Commercial Producers: Meeting Needs, Adding Value” Center for Food and Agricultural Business I am very confident in my own ability by Age Significantly different at p<.05
Source: 2003 National Conference for Agribusiness, “Serving Commercial Producers: Meeting Needs, Adding Value” Center for Food and Agricultural Business I am very optimistic about the future of farming by Age Significantly different at p<.05
Source: 2003 National Conference for Agribusiness, “Serving Commercial Producers: Meeting Needs, Adding Value” Center for Food and Agricultural Business General Attitudes • Producers tend to be confident and feel that they are successful • High growth and Under 35 producers are more confident, feel that they are successful, and see themselves as opinion leaders • Commercial producers are somewhat optimistic about the future of farming • Compared to 1993 and 1998, participants were more confident but less optimistic about the overall future of farming
Source: 2003 National Conference for Agribusiness, “Serving Commercial Producers: Meeting Needs, Adding Value” Center for Food and Agricultural Business Management Challenges by Primary Operation (Commercial Only) • Profitability • 53% of cotton growers vs. only 32% of dairy producers • Environment • 35% of dairy producers vs. 6% of cotton producers • Marketing • 14% of cattle producers vs. 1% of dairy producers • Expansion • 15% of corn/bean growers
Source: 2003 National Conference for Agribusiness, “Serving Commercial Producers: Meeting Needs, Adding Value” Center for Food and Agricultural Business Growth
Source: 2003 National Conference for Agribusiness, “Serving Commercial Producers: Meeting Needs, Adding Value” Center for Food and Agricultural Business Growth Plans • Understanding producers growth plans is critical in understanding the changing needs of producers • The survey asks producers about the growth plans over the next 5 years • We compare this to 1998 and 1993 to get a sense of how growth is changing in each enterprise
Source: 2003 National Conference for Agribusiness, “Serving Commercial Producers: Meeting Needs, Adding Value” Center for Food and Agricultural Business Growth of Operation • Commercial corn/soybean producers anticipate strong growth • Commercial wheat/barley/canola producers anticipate the least growth • Commercial dairy producers anticipate the highest growth
Source: 2003 National Conference for Agribusiness, “Serving Commercial Producers: Meeting Needs, Adding Value” Center for Food and Agricultural Business Expected Growth in Next 5 Years for Crop Producers** ** Does not include those exiting farming * Significantly different at p<.05
Source: 2003 National Conference for Agribusiness, “Serving Commercial Producers: Meeting Needs, Adding Value” Center for Food and Agricultural Business Expected Growth in Next 5 Years for Livestock Producers** ** Does not include those exiting farming * Significantly different at p<.05
Source: 2003 National Conference for Agribusiness, “Serving Commercial Producers: Meeting Needs, Adding Value” Center for Food and Agricultural Business Growth Predictions by Year NOTE: These do not include anyone who indicated they would not be farming in 5 years AND takes out all outliers with >300% growth predicted * Significantly different at p<.05
Source: 2003 National Conference for Agribusiness, “Serving Commercial Producers: Meeting Needs, Adding Value” Center for Food and Agricultural Business Growth Predictions by Year for Commercial Livestock Producers NOTE: These do not include anyone who indicated they would not be farming in 5 years AND takes out all outliers with >300% growth predicted * Significantly different at p<.05
Source: 2003 National Conference for Agribusiness, “Serving Commercial Producers: Meeting Needs, Adding Value” Center for Food and Agricultural Business High Growth Producers We took a look at the top 20% of growth in each enterprise to provide a quick view of the characteristics of high growth operators and here are some of the highlights:
Source: 2003 National Conference for Agribusiness, “Serving Commercial Producers: Meeting Needs, Adding Value” Center for Food and Agricultural Business High Growth in Each Commercial Segment (Top 20%) • Most 44 and under • Most concerned about expansion and management challenges • Most confident and optimistic
Source: 2003 National Conference for Agribusiness, “Serving Commercial Producers: Meeting Needs, Adding Value” Center for Food and Agricultural Business High Growth in Each Commercial Segment (Top 20%) • Higher reliance on local sources for information • More direct relationship with both Capital and Expendable suppliers • More reliance on sales/tech reps for information than before
Source: 2003 National Conference for Agribusiness, “Serving Commercial Producers: Meeting Needs, Adding Value” Center for Food and Agricultural Business Farm Operation Value-Enhanced/Contract Production
Source: 2003 National Conference for Agribusiness, “Serving Commercial Producers: Meeting Needs, Adding Value” Center for Food and Agricultural Business Value-Enhanced Production What percentage of your gross farm sales in 2002 (and 2008) to come from value-enhanced crops and/or livestock such as organic beef, tofu soybeans, etc.?