Download
1 / 33
350 likes | 608 Views
Fluorescence based self-encoding micro-bead sensor arrays. Analytical Chemistry Literature Seminar Louisiana State University 12 October 2009 Joyce W. Kamande. Overview. Importance of Vapor Analysis Concept of Artificial nose Comparison with other techniques Objective

E N D
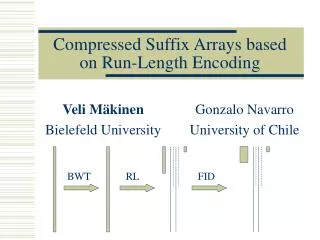
Fluorescence based self-encoding micro-bead sensor arrays Analytical Chemistry Literature Seminar Louisiana State University 12 October 2009 Joyce W. Kamande
Overview • Importance of Vapor Analysis • Concept of Artificial nose • Comparison with other techniques • Objective • Design and field implementation of a portable fluorescence based sensor • Spectrally resolved sensor imaging • Conclusion • Critique • Acknowledgements • Questions
Importanceof Vapor Analysis • Volatile organic compounds (VOC) • Hazards: Health –liver, kidney, respiratory • Environmental Pollution: Ozone, BTX gases etc. • Fragrances from flowers and perfumes • Aromas from food and beverage • Explosives –volatile nitro aromatic compounds http://www.texaninspection.com/graphics/pic_voc1.jpg
Chemical Vapor Sensing Techniques • Traditional Analytical Methods • GC-Olfactometry • GC-MS (mass spectroscopy) • IMS ( ion mobilty spectroscopy) • IR ( Infrared spectroscopy) • Biological methods • Canines (dogs) • Human sensory panels • Biomimetic methods • Electronic noses http://www.ptonline.com/mag_images/200703fa2c.jpg http://www.securityguarddog.co.uk/Images/security_dog/guarding_dog.jpg http://web.1.c2.audiovideoweb.com/1c2web3536/iSmell_LG.jpg
Biomimetics Biologically inspired technologies • Highly fuel efficient car • Electronic tongues which imitate the tongue and used for liquid sensing analysis which use potentiometric and voltametrics measure pH. • Electronic noses imitate the human noses for gas sensing analysis http://drvino.com/wp-content/uploads/2008/03/electronictongue.jpg http://specieslist.com/images/external/Mini4L.jpg
‘Electronic Nose Concept’ Orbitofrontal cortex Thalamus BIOLOGICAL NOSE Olfactorybulb Olfactory receptor cells Olfactory epithelium Nasal passage Sensor elements & Data acquisition system ELECTRONIC NOSE Pattern recognition algorithm Vapor delivery system http://www.electronichealing.co.uk/resources/Image/olfactory_system.jpg
About the Author • Robinson Professor of Chemistry at Tufts University • Founder and Director of Illumina Inc founded in 1988 to commercialize bead arrays created in the Walt lab • Published over 300 papers • Well renown for pioneering work in optical bead arrays and has applied this concept to DNA and Protein Analysis . Prof David R. Walt http://www.vanderbilt.edu/vicb/Images/Walt.jpg
Objective • Discuss latest developments in fluorescence based micro bead sensor arrays for vapor detection.
Nile Red Coating of Functionalized Silica Microbeads Non polar Polar SiO2 SiO2 SiO2 SiO2 C4 CN NH2 OH Nile Red/toluene 1mg/ml Nile Red/toluene 1mg/ml Nile Red/toluene 1mg/ml Nile Red/toluene 1mg/ml SiO2 SiO2 SiO2 SiO2 C4 CN NH2 OH
Solvatochromic effect of Nile Red CN OH NH2 C4 Albert, K.:and David R.Walt Anal. Chem. 2000,72,1947-1955
Formation of Microwells in Optical Fibre bundles Bundle of single core fibres Etch in mixture of HF and NH4F c Microwells formed watblog.com Epstein,J,R.;Walt,D.R.;Chem.Soc.Rev.,2003,32,203-204
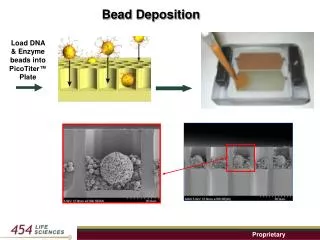
Micro-wells fabrication from optical fibers Nile red coated functionalized silica Microbeads (NRFSMB) Optical fibre bundle with microwells Optical fibre bundle packed with NRFSMB Epstein,J,R.;Walt,D.R.;Chem.Soc.Rev.,2003,32,203-204
Instrumental Set Up Pattern recognition system Albert K,J et al.;, Environ. Sci. Technol.2001,35 3193-3200 Epstein,J,R.;Walt,D.R.;Chem.Soc.Rev.,2003,32,203-204
Imaging of the Fiber Optic Arrays Sensor type a Vapor pulse Normalizedintensity Sensor type c Sensor type b Time (s) Normalized intensity Normalizedintensity Time (s) Time (s) Aernecke et al. Sensors and Actuators B: Article in press
A B C Mixture Albert K,J et al.;, Environ. Sci. Technol.2001,35 3193-3200 Dickinson, T.A et al. Anal. Chem. 1999, 71, 2192-2198
Design Implementation, and Field Testing of a Portable Fluorescence- Based Vapor Sensor Matthew J. Aernecke, Jian Guo, Sameer Sonkusale, and David R. Walt Anal. Chem. 2009,81,5281-5290
Portable Fluorescence-Based Vapor System 1 2 3 4 Mathew J. Aernecke, Jian Guo, Sameer Sonkusale, and David R. Walt Anal. Chem. 2009,81,5281-5290
Fabrication Microbead Array • Sensor type 1 ( Alltech) • Sensor type 2 ( Chirex) • Sensor type 3 (SCX) Mathew J. Aernecke, Jian Guo, Sameer Sonkusale, and David R. Walt Anal. Chem. 2009,81,5281-5290
Experimental Procedure Air Mathew J. Aernecke, Jian Guo, Sameer Sonkusale, and David R. Walt Anal. Chem. 2009,81,5281-5290
Individual vs Block Segmentation 1 Intensity 0 Time -1 1 Intensity 0 Run1 Run5 Time Run12 -1 Run15 Mathew J. Aernecke, Jian Guo, Sameer Sonkusale, and David R. Walt Anal. Chem. 2009,81,5281-5290
Experimental Procedure Keith J.Albert and David R.Walt Anal. Chem. 2000,72,1947-1955
Temporally Resolved Flourescence Spectroscopy of a Microarray-Based Vapor Sensing System. Mathew J. Aernecke. and David R. Walt Anal. Chem. 2009, 81, 5762-5769
Spectrally Resolved Sensor Imaging (SRSI) Transmission grating First order zero order First order Fluorescence intensity Fluorescence intensity Wavelength time time Mathew J. Aernecke and David R. Walt Anal. Chem. 2009, 81, 5762-5769
Spectrally Resolved Sensor Imaging(SRSI) Array Fabrication Add sensors Glass Cr Sputter RIE Glass wafer Photoresist Dissolve the resist Expose to UV light Cr etch Mathew J. Aernecke and David R. Walt Anal. Chem. 2009, 81, 5762-5769
Instrumental Setup Mathew J. Aernecke and David R. Walt Anal. Chem. 2009, 81, 5762-5769
480 nm Excitation Light 10x objective with grating Vapor Delivery 550 nm Long Pass Emission Filter Sensicam CCD Sensor Array Calibration LEDs Instrumental Set Up Mathew J. Aernecke- Correspondence with author
Microbead Mapping on Array Luna C8 Luna CN Luna OH Bulk Single sensor Mathew J. Aernecke and David R. Walt Anal. Chem. 2009, 81, 5762-5769 710
Time and Wavelength Resolved Response from a Single Luna C8 Sensor to Ethanol Ethanol • Exposure time 1 s • Bathochromic shift of 23 nm • Increase in intensity • Response time 10 s Air Raw fluorescence intensity Air Raw fluorescence intensity Time wavelength wavelength Mathew J. Aernecke and David R. Walt Anal. Chem. 2009, 81, 5762-5769
Classification of Accuracies vs Wavelength Classification Accuracy Number of Wavelengths Mathew J. Aernecke and David R. Walt Anal. Chem. 2009, 81, 5762-5769
Conclusions • Signal to noise enhancement through the measured response of thousand of beads • Portability-system captures all the essential elements of the larger laboratory based system. • Increase in dimensionality using the SRSI improves the classification system from 61.9% to 85.7% • SRSI is able to capture dynamic changes of a flourescence response from a single bead ( 10 s). • System can be used to analyze petroleum distillates and Volatile Organic compounds
Critiques The Luna C8 microbead sensor underwent photobleaching. Vapors with similar compositions could not clearly be distinguished by the pattern recognition system. Quantitative studies were not mentioned however given the saturated vapor pressures of the distillate the detection limits are estimated to lie between mid ppm to low ppm
Acknowledgements • Professor Soper • Soper Research Group • Audience