Download
1 / 7
70 likes | 196 Views
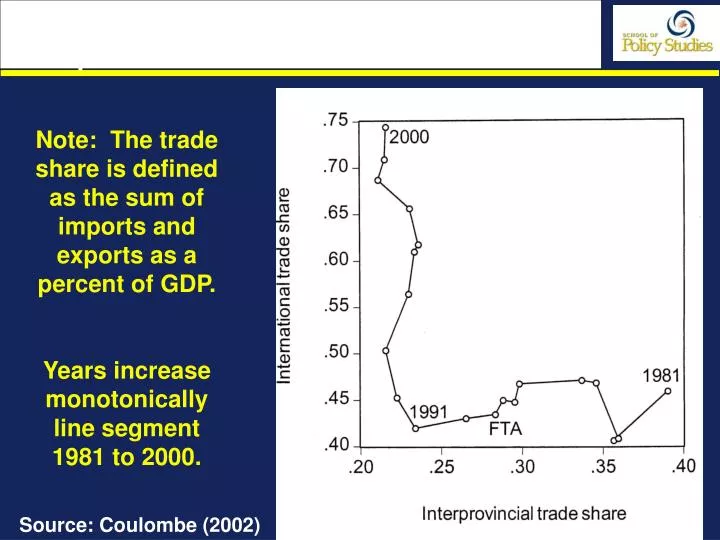
Fig. 6: The Canadian International and Interprovincial Trade Shares. Note: The trade share is defined as the sum of imports and exports as a percent of GDP. Years increase monotonically line segment 1981 to 2000. Source: Coulombe (2002).

E N D
Fig. 6: The Canadian International and Interprovincial Trade Shares Note: The trade share is defined as the sum of imports and exports as a percent of GDP. Years increase monotonically line segment 1981 to 2000. Source: Coulombe (2002)
Fig 7: Ontario’s Interprovincial and International Exports % GDP
Fig. 1: Canada’s Read Exchange Rate vis-à-vis U.S. Dollar and Current Account Balance with the U.S., 1989-2001 Real exchange rate, 1990 = 100 Current account (left Scale) scale) Real Exchange rate (right scale)
Fig. 8: U.S. States Exports to Canada as Percent of Total Exports, 1999
Aggregate Flows • From Table 1 (Handout) 1989 2001 X/GDP 25% 43% US SHARE 73% 87% US X/GDP 18.6% 37.6% INTERPROVINCIAL EXPORTS 22.5% !9.7%