Download

1 / 64
660 likes | 872 Views
One-Way ANOVA. ANOVA = Analysis of Variance This is a technique used to analyze the results of an experiment when you have more than two groups. Example. You measure the number of days 7 psychology majors, 7 sociology majors, and 7 biology majors are absent from class

E N D
One-Way ANOVA • ANOVA = Analysis of Variance • This is a technique used to analyze the results of an experiment when you have more than two groups
Example • You measure the number of days 7 psychology majors, 7 sociology majors, and 7 biology majors are absent from class • You wonder if the average number of days each of these three groups was absent is significantly different from one another
Results X = 3.00 X = 2.00 X = 1.00
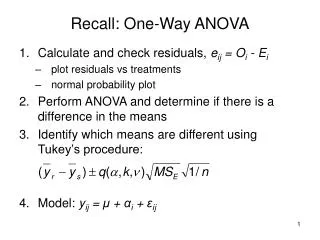
Hypothesis • Alternative hypothesis (H1) • H1: The three population means are not all equal
Hypothesis • Null hypothesis (H0) psych = socio =bio
Between and Within Group Variability • Two types of variability • Between • the differences between the mean scores of the three groups • The more different these means are, the more variability!
Results X = 3.00 X = 2.00 X = 1.00
Between Variability S2 = .66 X = 3.00 X = 2.00 X = 1.00
Between Group Variability • What causes this variability to increase? • 1) Effect of the variable (college major) • 2) Sampling error
Between and Within Group Variability • Two types of variability • Within • the variability of the scores within each group
Results X = 3.00 X = 2.00 X = 1.00
Within Variability S2 =.57 S2 =1.43 S2 =.57 X = 3.00 X = 2.00 X = 1.00
Within Group Variability • What causes this variability to increase? • 1) Sampling error
Between and Within Group Variability Between-group variability Within-group variability
Between and Within Group Variability sampling error + effect of variable sampling error
Between and Within Group Variability sampling error + effect of variable sampling error Thus, if null hypothesis was true this would result in a value of 1.00
Between and Within Group Variability sampling error + effect of variable sampling error Thus, if null hypothesis was not true this value would be greater than 1.00
Degrees of Freedom • dfbetween • dfwithin • dftotal • dftotal = dfbetween + dfwithin
Degrees of Freedom • dfbetween = k - 1 (k = number of groups) • dfwithin = N - k (N = total number of observations) • dftotal = N - 1 • dftotal = dfbetween + dfwithin
Degrees of Freedom • dfbetween = k - 1 3 - 1 = 2 • dfwithin = N - k 21 - 3 = 18 • dftotal = N - 1 21 - 1 = 20 • 20 = 2 + 18
Sum of Squares • SSBetween • SSWithin • SStotal • SStotal = SSBetween + SSWithin
Sum of Squares • SStotal
Sum of Squares • SSWithin
Sum of Squares • SSBetween
Sum of Squares • Ingredients: • X • X2 • Tj2 • N • n
X Xs = 21 Xp = 14 XB = 7
X X = 42 Xs = 21 Xp = 14 XB = 7
X2 X = 42 Xs = 21 Xp = 14 XB = 7 X2s = 67 X2P = 38 X2B = 11
X2 X = 42 X2 = 116 Xs = 21 Xp = 14 XB = 7 X2s = 67 X2P = 38 X2B = 11
T2 = (X)2 for each group X = 42 X2 = 116 Xs = 21 Xp = 14 XB = 7 X2s = 67 X2P = 38 X2B = 11 T2P = 196 T2B = 49 T2s = 441
Tj2 X = 42 X2 = 116 Tj2= 686 Xs = 21 Xp = 14 XB = 7 X2s = 67 X2P = 38 X2B = 11 T2P = 196 T2B = 49 T2s = 441
N X = 42 X2 = 116 Tj2= 686 N = 21 Xs = 21 Xp = 14 XB = 7 X2s = 67 X2P = 38 X2B = 11 T2P = 196 T2B = 49 T2s = 441
n X = 42 X2 = 116 Tj2= 686 N = 21 n = 7 Xs = 21 Xp = 14 XB = 7 X2s = 67 X2P = 38 X2B = 11 T2P = 196 T2B = 49 T2s = 441
X = 42 X2 = 116 Tj2= 686 N = 21 n = 7 Ingredients
X = 42 X2 = 116 Tj2= 686 N = 21 n = 7 Calculate SS • SStotal
X = 42 X2 = 116 Tj2= 686 N = 21 n = 7 Calculate SS • SStotal 42 32 116 21
X = 42 X2 = 116 Tj2= 686 N = 21 n = 7 Calculate SS • SSWithin
X = 42 X2 = 116 Tj2= 686 N = 21 n = 7 Calculate SS • SSWithin 686 18 116 7
X = 42 X2 = 116 Tj2= 686 N = 21 n = 7 Calculate SS • SSBetween
X = 42 X2 = 116 Tj2= 686 N = 21 n = 7 Calculate SS • SSBetween 14 686 42 7 21
Sum of Squares • SSBetween • SSWithin • SStotal • SStotal = SSBetween + SSWithin
Sum of Squares • SSBetween = 14 • SSWithin = 18 • SStotal = 32 • 32 = 14 + 18