Download
1 / 34
340 likes | 459 Views
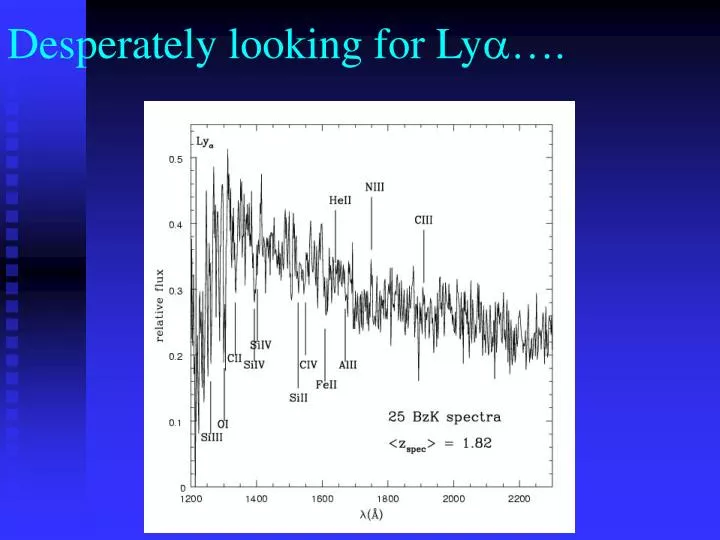
Desperately looking for Ly a …. DRGs at z~2. Galaxies selected from near-IR photometry [(J-K)>2.3] Most would NOT be selected by LBG criteria (UV selection) However, overlap with LBG not quantified And certainly significant (see Adelberger Et al. 2004).

E N D
DRGs at z~2 Galaxies selected from near-IR photometry [(J-K)>2.3] Most would NOT be selected by LBG criteria (UV selection) However, overlap with LBG not quantified And certainly significant (see Adelberger Et al. 2004). They appear in general more evolved, I.e. more massive (larger clustering), with larger stellar mass, more metal rich, and more dust obscured) than LBGs. Occurrence of AGN also seems higher. At z~3 these galaxies have about 50% of the volume density of LBGs (highly uncertaint). However; they possibly contribute about up to 100% of the LBG stellar mass density, because they have higher M/L ratios Van Dokkum et al. 2004
Lya to look for high-z LSS: Protoclusters Wang et al. 2005 Identified an obvious and strong large-scale structure at redshift z~5.75 in a wide (31'×33') field, narrow-band survey of the Chandra Deep Field-South region. This structure is traced by 17 candidate Lya emitters, among which 12 are found in an 823 nm filter (corresponding to Lya at z=5.77+/-0.03) and five in an 815 nm image (z=5.70+/-0.03). The Lya emitters in both redshift bins are concentrated in one quadrant of the field. Our results are consistent with reports of an overdensity in the Ultra Deep Field region at z~5.9. This structure is the highest redshift overdensity found so far.
Lya Surveys to search for LSS: Proto Superclusters Shimasaku et al.
Lya Surveys to search for LSS Very useful to observe structures at the same redshift. LBGs not efficient to do this Matsuda et al.
The Lya Blobs Photo-ionization by SF or AGN? Why so rare? What are they? Matsuda et al.
The Lya Blobs Matsuda et al.
Ha Surveys • The amplification of optical path through the ISM by resonant scatter makes Lya a fragile line: even small amount of dust can quench the feature. • Moreover, the highly unpredictable obscuration makes Lya a poor star formation indicator. • Ha exempt from this problem, and less subject to dust obscuration. Especially when no detections were reported in Lya surveys, Ha was targeted for searches to identify galaxies at high redshifts • Problem: at z>0.4, Ha is redshifted to the near-IR: loss of sensitivity (sky, thermal bckgnd) and of area coverage (small detector size) • Today, identification of high-z galaxies not a problem any longer. However, Ha surveys still desirable to get a handle of dust obscuration of SFR
Ha Surveys. I • Early narrow-band imaging surveys for distant galaxies were carried at the Calar Alto 3.6-m telescope: • Thompson, Mannucci & Beckwith 1996 and Beckwith et al. 1998, around known QSO and radio galaxies: one emission line galaxy at z=2.430 over 276 arcmin2, down to 3.4•10-16 erg cm-2 s-1 and most sensitive part 1.4•10-16 erg cm-2 s-1 (3s) • Mannucci et al. 1998, around known DLA, MgII and CIV QSO absorption systems: 16 Ha galaxies at z=2.3 and 2 [OII] galaxies at z=0.89, over 163 arcmin2, down to 2•10-16 erg cm-2 s-1 (3s)
[OIII] and Ha Surveys. II • Deep survey carried out from Keck with the NIRC instrument: • Teplitz, Malkan, & McLean (1999), also around known QSOs and QSO MgII and CIV QSO absorption systems: 1 [OIII] galaxy at z=3.31 or Ha galaxy at z=2.3 over 11 arcmin-2, possibly other 12 objects, down to 7•10-17 erg cm-2 s-1 (3s)
Ha Surveys. III • Near-IR observations from space with HST and NICMOS reach very high sensitivity thanks to fainter sky (even with smaller telescope): • McCarthy et al. (1999), parallel slitless grism spectroscopy in random fields, over 64 arcmin-2 down to 4•10-17 erg cm-2 s-1 (3s) [60% deeper than deepest ground-based survey]. Found 33 emission-line galaxies, likely Ha at 0.7<z<1.9, with <We>=40 Ang. • Median Ha luminosity is 2.7•1042 erg s-1, and star-formation rates in the range 1<SFR<324 MO yr-1, with <SFR>=21MO yr-1
Ha Surveys From Space McCarthy et al. (1999)
Ha Surveys From Space McCarthy et al. (1999)
Ha Surveys From Space: Sensitivity McCarthy et al. (1999)
Ha Surveys Results: SFR Diagnostic • Tresse et al. 2002, MNRAS, 337, 369, Ha LF up to z~1 • Hopkins, A & Connolly, A. 2000, ApJ, 129, 2843, SFR in galaxies at .7<z<1.8 from NICMOS grism parallel Ha survey. Find average 2-3 higher SFR from Ha than from UV, as seen locally. • Teplitz et al. 2003, ApJ, 589, 704, STIS Parallel Survey, survey for [OII]; implies substantial extinction • Drozdovsky et al. 2005, ApJ, 130, 1324, ACS grism parallel survey for ELGs at z<1.6, [OII], Hb, [OIII], Ha • Doherty et al. 2006, MNRAS, 370, 331, Ha w/ CIRPAS of HDF-N FF • Kicks, et al. 2002, ApJ, 581, 205, NICMOS parallel Ha survey. Derive downward revised calibration of [OII]; also revised diagnostics • All conclude SF increase ~(1+z)3-4 to z~1, find extinction affects UV by ~3x, find [II] traces SF.
Ha Surveys Results: SF Diagnostics • Mouhcine et al. 2005, MNRAS, 362, 1143, ratio of [OII]/Ha of 2dF galaxies, difference from Madrid due to selection effects (Ha selection vs. B-band selection) • Moustakas, Kennicutt, Tremonti 2006, ApJ, 642, 775, dust-obscured Ha good indicator of SFR, even in highly obscured SF galaxies. [OII] can be calibrated as a SFR indicator, and dependence of metallicity reduced. • Mustakas, Kennicutt, 2006, ApJ, 651, 155, Unlike the integrated R23 parameter, we find that the integrated [N II]/Ha and [S II]/Ha ratios are enhanced with respect to line ratios typical of H II regions, consistent with a modest contribution from diffuse ionized gas emission. We conclude that the R23 parameter can be used to reliably measure the gas-phase abundances of distant star-forming galaxies.
Ha Surveys Results: SF Diagnostics Hicks et al. 2002 Optical spectra of 14 emission-line galaxies from the NICMOS Ha survey of McCarthy et al. are presented. Of the 14, 9 have emission lines confirming the redshifts found in the grism survey. The higher resolution of the new spectra improves the redshift accuracy by a factor of 5. The [O II]/Ha values are found more than 2 times lower than expected from Jansen et al. This [O II]/Ha ratio discrepancy most likely explained by additional reddening in our Ha-selected sample [on average, as much as an extra E(B-V)=0.6], as well as by a possible stronger dependence of the [O II]/Ha ratio on galaxy luminosity than is found in local galaxies. The result is that star formation rates (SFRs) calculated from [O II]l3727 emission, uncorrected for extinction, are found to be on average 4+/-2 times lower than the SFRs calculated from Ha emission. Classification of emission-line galaxies as starburst or Seyfert galaxies based on comparison of the ratios [O II]/Hb and [Ne III]l3869/Hb is discussed. New Seyfert 1 diagnostics using the Ha line luminosity, H-band absolute magnitude, and Ha equivalent widths are also presented. One galaxy is classified as a Seyfert 1 based on its broad emission lines, implying a comoving number density for Seyfert 1 galaxies of 2.5+5.9-2.1×10⁻⁵ Mpc-3, a factor of 2.4+5.5-2.0 times higher than estimated by other surveys.
Ha Surveys Results: SF Diagnostics at z~2 Erb et al. 2006: UV and Ha can be used as tracers of SF in distant SF galaxies that are not too obscured by dust.
The history of the cosmic star formation activity (madau diagram) In the local universe, Ha survey are key to measure the SFD: Zamorano et al. 1994, 1996; Alonso et al. 1995Gallego, J et al. 1995 At High-z contunuum-based measures preferred. But Lya might help at the faint end of LF At z~6 the cosmic star formation activity was ~as vigorous as it was between z~2 and z~3. a=-1.6 assumed Giavalisco et al. 2004 Giavalisco et al. 2006, in prep.
Mergers? Disks? Star-formation in filaments of cold gas in DM halos? Ravindranath et al. 2006 35 kpc (180 comoving)
Ha Rotation curves at z~2 GOODS large area and angular resolution enabled the first systematic kinematical studies of galaxies at z~2 Erb et al. 2004 Steidel et al. 2004 13 GOODS-N galaxies morphologically selected
Ha Rotation curves at z~2 Only 3 out of 13 galaxies show evidence of coherent velocity field/shear What is the relationship between morphology and kinematics? Erb et al. 2004 Steidel et al. 2004 HDF-BX691
Galaxy kinematics at z~2 Elongated galaxies appear to have lower velocity dispersions Still small samples. More Ha spectroscopic time needed Erb et al. 2004
Ha IFU spectroscopy at z~2: Evidence for Disks Galaxies with irregular morphologies appear to be disks Already dynamically assembled at z~2 Implicataions could be that mering rate estimated from Distorted morphology is (possibly greatly) overestimated Forster-Schreiber et al. 2006
Ha IFU spectroscopy at z~2: Evidence for Disks Forster-Schreiber et al. 2006
[OIII] Surveys: Planetary Nebulae Mendez et al. 2001