Download
1 / 39
390 likes | 556 Views
ECG interpretation for beginners – 2 Axel en Luc De Wolf RZ Tienen UZ Leuven. INFLUENCE OF TIME-TO-TREATMENT ON THE ODDS RATIO (OR) OF MORTALITY. 3. 80.

E N D
ECG interpretation for beginners – 2Axel en Luc De Wolf RZ Tienen UZ Leuven
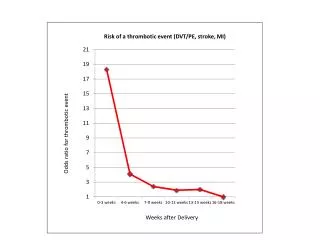
INFLUENCE OF TIME-TO-TREATMENT ON THE ODDS RATIO (OR) OF MORTALITY 3 80 The “golden hour”: 65 lives are saved for every 1,000 patients treated when the treatment is initiated within the first hour of symptom onset! PATHOPHYSIOLOGY + EPIDEMIOLOGY THROMBOLYSIS IN CLINICAL TRIALS AND REGISTRIES NEW TRIALS/ REGISTRIES MANAGEMENT OF ACUTE MI AND THE RATIONALE FOR EARLY REPERFUSION CLINICAL QUESTIONS METALYSE (+ PRESCRIBING INFORMATION) COSTS REFERENCES SYSTEM REQUIREMENTS IMPRESSUM 60 ABSOLUTE BENEFIT PER 1,000TREATED PATIENTS 40 20 0 15 3 6 9 12 18 21 24 0 TREATMENT DELAY IN HOURS Boersma et al. Lancet 1996; 348: 771–775.
A heart • Blood circulates, passing near every cell in the body, driven by this pump • …actually, two pumps… • Atria = turbochargers • Myocardium = muscle • Mechanical systole • Electrical systole
A system • Quality of ECG? • Rate • Rhythm • Axis • P wave • PR interval • QRS duration • QRS morphology • Abnormal Q waves • ST segment • T wave • QT interval
A system • Quality of ECG? • Rate • Rhythm • Axis • P wave • PR interval • QRS duration • QRS morphology • Abnormal Q waves • ST segment • T wave • QT interval
P wave • Are there P waves….? • Pointy = P pulmonale (RA hypertrophy)>2,5mm • Bifid = P mitrale (LA hypertrophy)>2,5mm • Not very accurate or useful….
PR interval • Start of P wave to start of QRS • Normal = 0.12-0.2s • Too short – can mean WPW syndrome (ie. an accessory pathway), or normal! • Too long –means AV block (heart block) - 1st/2nd/3rd degree
A system • Quality of ECG? • Rate • Rhythm • Axis • P wave • PR interval • QRS duration • QRS morphology • Abnormal Q waves • ST segment • T wave • QT interval
QRS complex • Should be <0.12s duration • >0.12s = BBB (either LBBB or RBBB) • ‘Pathological’ Q waves can mean a previous MI (? territory) • >25% size of subsequent complex • Q waves are allowed in V1, aVR and III
BBB Look at V1 and V6 W I LL ia M = LBBB M a RR o W = RBBB
QRS complex • Is there LVH? • Sum of the Q or S wave in V1 and the biggest R wave in V5 or V6 >35mm • (R wave in aVL >11mm) • Not actually very useful….
A system • Quality of ECG? • Rate • Rhythm • Axis • P wave • PR interval • QRS duration • QRS morphology • Abnormal Q waves • ST segment • T wave • QT interval
ST segment • ST depression • Downsloping or horizontal = abnormal • Ischaemia (coronary stenosis) • If lateral (V4-V6), consider LVH with ‘strain’ or digoxin (reverse tick sign) • ST elevation • Infarction (coronary occlusion) • Pericarditis (widespread) • These are usually in ‘territories’ eg. anterior/lateral/inferior etc. and will be present in contiguous leads
T wave • Peaked (hyperkalaemia or normal young man) • Inverted/biphasic (ischaemia, previous infarct) • Small (hypokalaemia) • No pot, no tea!
QT interval • Don’t worry about too much… • Start of QRS to end of T wave • Needs to be corrected for HR • Various formulae • eg. Bazett’s: • Computer calculated often wrong • Long QT can be genetic (long QT sy.) or secondary eg. drugs (amiodarone, sotalol) • Associated with risk of sudden death due to Torsades de Pointes
Morfologische afwijkingen Hypertrofie Voorkamer en Kamer
K51 – Rechter voorkamerhypertrofie Dilatatie van de rechter voorkamer Hoge spitse P toppen in afl. II & aVF ( 0,25 mV) Toename initiële P voltage in afl. II, III, aVF & V1 Normale duur P golf Vaak in combinatie met tekenen van rechter kamerhypertrofie P pulmonale
Dilatatie van de linker voorkamer P golf > 120 ms GehaakteP top door toenameamplitude terminaaldeel van P golf in afl. I, II, aVL & V6 BifasischeP golfin afl. V1 met terminaalnegatiefdeel ( 0,1 mV, 40 ms) K52 - Linker voorkamerhypertrofie Risico op atriale fibrillatie
(R in V5 of V6) + (S in V1 of V2) > 3,5 mV (35 mm) ST elevatie concaaf naar boven met hoge positieve T top in rechtszijdige afleidingen ST depressie convex naar boven met asymmetrisch negatieve T top in linkszijdige afleidingen Normale as K53 - Linker kamerhypertrofie
As the heart muscle wall thickens there is an increase in electrical forces moving through the myocardium resulting in increased QRS voltage. Increased QRS voltage Left Ventricular Hypertrophy Why is left ventricular hypertrophy characterized by tall QRS complexes? LVH ECHOcardiogram For more presentations www.medicalppt.blogspot.com
Left Ventricular Hypertrophy • Criteria exists to diagnose LVH using a 12-lead ECG. • For example: • The R wave in V5 or V6 plus the S wave in V1 or V2 exceeds 35 mm. • However, for now, all you need to know is that the QRS voltage increases with LVH. For more presentations www.medicalppt.blogspot.com
Hoge R in V1 (> 0,7 mV) met R/S ratio > 1 Vlakke R progressie Diepe S in V5-V6 ( > 0,7 mV) met R/S ratio < 1 qR of rSR’ in V1 met hoge spitse R’ (diff. diagnose RBTB) Hoge, terminale R in aVR Rechter asdeviatie (komt overeen met diepe S in I en aVL) K55 – Rechter kamerhypertrofie Kliniek van longlijden
K56 - Ischemie Wanneer een elektrode geplaatst wordt tegenover een zone van ischemie betekent - ST segment depressie: subendocardiale ischemie - ST segment elevatie: transmurale (subepicardiale) ischemie
Characteristic changes in AMI • ST segment elevation over area of damage • ST depression in leads opposite infarction • Pathological Q waves • Reduced R waves • Inverted T waves
R ST P Q ST elevation • Occurs in the early stages • Occurs in the leads facing the infarction • Slight ST elevation may be normal in V1 or V2
R ST P T Q Deep Q wave • Only diagnostic change of myocardial infarction • At least 0.04 seconds in duration • Depth of more than 25% of ensuing R wave
R ST P T Q T wave changes • Late change • Occurs as ST elevation is returning to normal • Apparent in many leads
Bundle branch block Anterior wall MI Left bundle branch block aVR aVL aVF V1 V2 V3 V4 V5 V6 aVR aVL aVF V1 V2 V3 V4 V5 V6 I II III I II III
Sequence of changes in evolving AMI R R R ST ST T P P P T Q Q S Q 1 minute after onset 1 hour or so after onset A few hours after onset R ST T ST P P P T T Q Q Q A few months after AMI A day or so after onset Later changes
aVR aVL aVF V1 V2 V3 V4 V5 V6 I II III Anterior infarction Anterior infarction Left coronary artery
aVR aVL aVF V1 V2 V3 V4 V5 V6 I II III Inferior infarction Inferior infarction Right coronary artery
aVR aVL aVF V1 V2 V3 V4 V5 V6 I II III Lateral infarction Lateral infarction Left circumflex coronary artery
Location of infarct combinations I aVR V1 V4 ANT POST LATERAL ANT SEPTAL aVL II V2 V5 ANT LAT V3 V6 aVF III INFERIOR
Diagnostic criteria for AMI • Q wave duration of more than 0.04 seconds • Q wave depth of more than 25% of ensuing r wave • ST elevation in leads facing infarct (or depression in opposite leads) • Deep T wave inversion overlying and adjacent to infarct • Cardiac arrhythmias