Download

1 / 35
360 likes | 609 Views
UTILIZING QUALITY FUNCTION DEPLOYMENT TO CONSTRUCT A BALANCED SCORECARD MAP. Shuki Dror & Miryam Barad Ort Braude College Karmiel Tel Aviv University Israel. Agenda. Balanced Scorecard Map Quality Function Deployment (QFD) QFD Balanced Scorecard Construction Map Illustrative Example

E N D
UTILIZING QUALITY FUNCTION DEPLOYMENT TO CONSTRUCT A BALANCED SCORECARD MAP Shuki Dror & Miryam Barad OrtBraudeCollegeKarmielTel Aviv University Israel
Agenda • Balanced Scorecard Map • Quality Function Deployment (QFD) • QFD Balanced Scorecard Construction Map • Illustrative Example • Conclusions
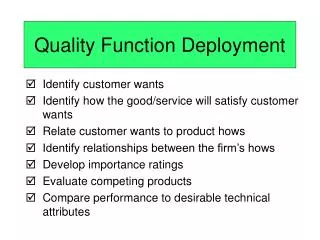
Balanced Scorecard Map • The Balanced Scorecard Map is a strategic frame with four perspectives: • Financial measures • Customer orientation • Internal businessprocesses • Learning and growth
Cause and Effect Relationships • It develops strategic cause and effect relationships by linking measures of financial performances to measures on their drivers.
Financial Perspective RevenueGrowth Productivity Customer Perspective Product/Service Internal Perspective Internal Processes Learning Perspective Learning
Guidelines are needed • To construct a balanced scorecard map some basic guidelines are needed.
Quality Function Deployment (QFD) • Product quality design methodology. • The QFD technique was developed in 1972 at Mitsubishi and during the 80's and the 90’s has been gradually and successfully adopted by U.S. and Japanese firms.
Quality Function Deployment (QFD) • Extract the customers' needs or desires and translate them into demands on technical product characteristics, engineering parameters and ultimately into production systems.
Learning type/level Induced Operational Conceptual Relative weight Customer Perspective Relative weight Internal Perspective MATRIX 5 Quality and service performances Internal Processes Time/cost performances Internal Processes MATRIX 3 Product and service technical performances Internal perspective Efficiency Customer perspective Customer types and benefits Input from customers Product quality & service Input from team MATRIX 4 MATRIX 2 Relative weights Customer Types MATRIX 1 Relative weight Internal Perspective Input from management Revenue Growth Productivity
Learning type/level Induced Operational Conceptual Relative weight Customer Perspective Relative weight Internal Perspective MATRIX 5 Quality and service performances Internal Processes Time/cost performances Internal Processes MATRIX 3 Product and service technical performances MATRIX 4 Internal perspective Efficiency Input from customers Product quality & service Input from team MATRIX 2 Customer perspective Customer types and benefits MATRIX 1 Relative weights Customer Types Relative weight Internal Perspective Input from management Revenue Growth Productivity
Learning type/level Induced Operational Conceptual Relative weight Customer Perspective Relative weight Internal Perspective MATRIX 5 Quality and service performances Internal Processes Time/cost performances Internal Processes MATRIX 3 Product and service technical performances MATRIX 4 Internal perspective Efficiency Customer perspective Customer types and benefits Input from customers Product quality & service Input from team MATRIX 2 MATRIX 1 Relative weights Customer Types Relative weight Internal Perspective Input from management Revenue Growth Productivity
Learning type/level Induced Operational Conceptual Relative weight Customer Perspective Relative weight Internal Perspective MATRIX 5 Quality and service performances Internal Processes Time/cost performances Internal Processes MATRIX 3 Product and service technical performances MATRIX 4 Internal perspective Efficiency Customer perspective Customer types and benefits Input from customers Product quality & service Input from team MATRIX 2 MATRIX 1 Relative weights Customer Types Relative weight Internal Perspective Input from management Revenue Growth Productivity
Learning type/level Induced Operational Conceptual Relative weight Customer Perspective Relative weight Internal Perspective MATRIX 5 Quality and service performances Internal Processes Product and service technical performances Customer perspective Customer types and benefits Input from customers Product quality & service Input from team Time/cost performances Internal Processes MATRIX 3 MATRIX 4 MATRIX 2 Internal perspective Efficiency MATRIX 1 Relative weights Customer Types Relative weight Internal Perspective Input from management Revenue Growth Productivity
Learning type/level Induced Operational Conceptual Relative weight Customer Perspective Relative weight Internal Perspective MATRIX 5 Quality and service performances Internal Processes Product and service technical performances Customer perspective Customer types and benefits Input from customers Product quality & service Input from team Time/cost performances Internal Processes MATRIX 3 MATRIX 4 MATRIX 2 Internal perspective Efficiency MATRIX 1 Relative weights Customer Types Relative weight Internal Perspective Input from management Revenue Growth Productivity
Learning type/level Induced Operational Conceptual Relative weight Customer Perspective Relative weight Internal Perspective MATRIX 5 Quality and service performances Internal Processes Product and service technical performances Customer perspective Customer types and benefits Input from customers Product quality & service Input from team Time/cost performances Internal Processes MATRIX 3 MATRIX 4 MATRIX 2 Internal perspective Efficiency MATRIX 1 Relative weights Customer Types Relative weight Internal Perspective Input from management Revenue Growth Productivity
Learning type/level Induced Operational Conceptual Relative weight Customer Perspective Relative weight Internal Perspective MATRIX 5 Quality and service performances Internal Processes Product and service technical performances Customer perspective Customer types and benefits Input from customers Product quality & service Input from team Time/cost performances Internal Processes MATRIX 3 MATRIX 4 MATRIX 2 Internal perspective Efficiency MATRIX 1 Relative weights Customer Types Relative weight Internal Perspective Input from management Revenue Growth Productivity
Learning type/level Induced Operational Conceptual Relative weight Customer Perspective Relative weight Internal Perspective Quality and service performances Internal Processes Product and service technical performances Customer perspective Customer types and benefits Input from customers Product quality & service Input from team MATRIX 5 Time/cost performances Internal Processes MATRIX 3 MATRIX 4 MATRIX 2 Internal perspective Efficiency MATRIX 1 Relative weights Customer Types Relative weight Internal Perspective Input from management Revenue Growth Productivity
Induced Learning • Induced learning is training at the individual level and developing/enhancing Information Systems/Technology.
Operational & Conceptual Learning • Operational learning and conceptual learning are viewed here as combinations of organizational structures and improvement tools. • Both operational learning and conceptual learning involve teams.
Operational Learning • Operational learning as being achieved by means of local teams using rather basic tools such as the seven basic graphical tools or SPC.
Conceptual Learning • Conceptual learning has a wider scope and as such has to rely on cross functional teams applying more sophisticated tools such as enhanced QFD and advanced statistical tools such as Design of Experiments (DOE).
Cross Functional Team • Finance • Market oriented • Information systems • Human resource members • Industrial engineers • R&D representatives
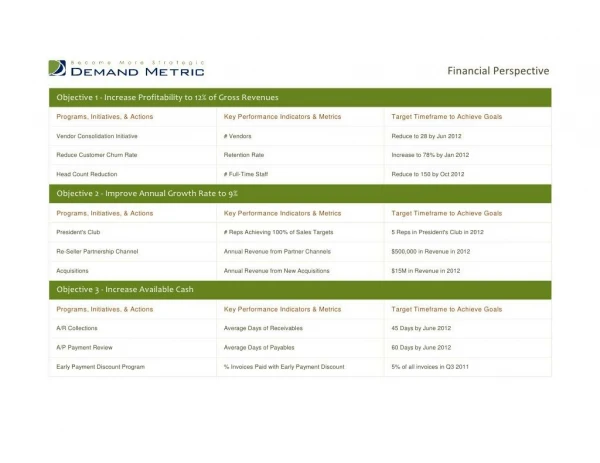
Matrix 1 - Deployment of the financial perspective Importance
Matrix 2 – The House of Quality in simplified form Importance Sales Point WeightedImportance Users (0.45) Productperformance Customer Perspective Retailers (0.20) Service performance
Matrix 3 – Deployment of product/service technical characteristics Importance Flexibility Product and service technical performances Time Quality
Matrix 4 – Deployment of internal efficiency Importance Efficiency (0.35)
Matrix 5 – Deployment of internal process performances Importance Response Process Time Internal Processes Process Cost Process Quality Design Quality
Conclusions • The QFD matrices ensure that every financial performance defined by the enterprise strategy is linked to a set of performance measures in the relevant domains that may eventually influence its future results. • Through QFD, priorities for improving performance measures in each of the three other domains are determined.
Conclusions • The QFD matrices warrant that proposed learning actions are consistent with eventual financial results. • The QFD systematic approach assists in organizing the balanced scorecard thus promoting continuous improvement for achieving strategic goals.
E N D