Download
1 / 40
400 likes | 564 Views
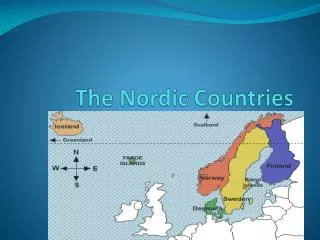
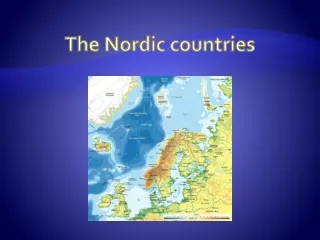
Status and potential for the aquaculture industry in the Nordic countries. Knut A. Hjelt Dep. Managing Director Norwegian Seafood Federation - Aquaculture. Nordic countries. Finland 5.19 mill Sweden 8,88 mill Denmark 5,39 mill. Faroe Islands 0,046 mill. Iceland 0,28 mill.

E N D
Status and potential for the aquaculture industry in the Nordic countries Knut A. Hjelt Dep. Managing Director Norwegian Seafood Federation - Aquaculture
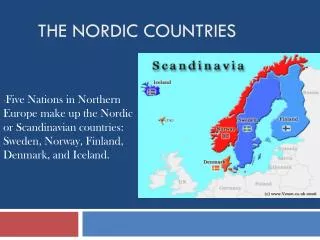
Nordic countries • Finland 5.19 mill • Sweden 8,88 mill • Denmark 5,39 mill. • Faroe Islands 0,046 mill. • Iceland 0,28 mill. • Norway 4,55 mill. ∑ 24,336 mill.
Total area: 337.030 km2 • Water : 31.560 km2 • Coastline : 1.126 km • (ex islands and coastal identations) • Areas for aquaculture • Freshwater (rivers and lakes) • Aaland Islands • Helsinki – Rauma • Vaasa
Finland (2001 figures) • Smolt/fry units: 126 (101 in freshwater) • for enhancement and aquaculture • + ≈ 300 natural dams (extensive production and enhancement) • Ongrowing units: 247 (173 at sea) • 46 (sea) at Åland • 2/3 of total production from Åboland and Åland
Total area: 449.964 km2 • Water : 39.030 km2 • Coastline : 3.218 km • (ex islands and coatal identations) • Areas for aquaculture • Inland freshwater bodies • West coast
Total area: 43.094 km2 • Water : 700 km2 • Coastline : 7.314 km • (inc. islands and coastal identations) • Areas for aquaculture • Inland freshwater • Inter islands
Denmark (Rainbow trout - 2001 figures) • Freswater onshore units:388 (1989:510) • All situated at Jylland • Production ≈33.000 mt (0,2-0,3kg) • Seabased production units:22 • Jylland/Fyn: 14 (3.100 mt) • Sjælland/Bornholm/islands:8 (2.800mt) • Size:2+
Biomass and landings of blue mussels in danish waters
Total area: 1.399 km2 • Water : 0 km2 • Coastline : 1.117 km • (inc. islands and coastal identations) • Areas for aquaculture • Between islands • Sheltered waters
Faroe Islands – aquaculture sites Freshwater sites (green) Saltwater sites (blue)
Total area: 103.000 km2 • Water : 2.750 km2 • Coastline : 4.988 km • (inc. islands and coastal identations) • Areas for aquaculture • Inland freshwater • SW, W and NW coast
Total area: 324.220 km2 • Water : 16.360 km2 • Coastline : 21.925 km • (inc. mainland: 3,419 • large islands: 2.413 • fjords, small islands and minor identations: 16.093) • Areas for aquaculture • Rivers • The coast from Stavanger to Kirkenes
Norway – salmon and trout production 2003
Future potential • -/0 Temperature, water quality,Baltic sea //water treatment - technology • o/+ Temperature, freshwater, Baltic sea//water treatment - technology • 0/+ Freshwater, organic effluents//water treatment - technology • 0/+ Area, freshwater, health//other species, health, technology • + //thermal energy, acsess to warm water, cage production at sea, environment, technology • (-)/++ wild populations, health//alternative species, areas, environment, technology
Future challenges • Management • Sustainability • Animal health and animal welfare • Technology • Developing an industry always has a cost • Cost/befit –sustainability • Political issue
Why this reduction? • Good sites • Only one generation per site (site rotation) • Good management – fish welfare • Good vaccines • Strict veterinary control of all farms • Avoidance of resistance to medicines • Strict rules for movement of live fish • All medicines approved according to environmental effects
Breeding • No GMO fish! • No hormone manipulation accepted in Norway