Download
1 / 15
150 likes | 241 Views
Legal Applications. Education applications and potential use for liability and remedy. Opportunity Mapping and Education. Since the racialized nature of opportunity isolation is a spatial phenomena, maps are naturally an effective way to represent it

E N D
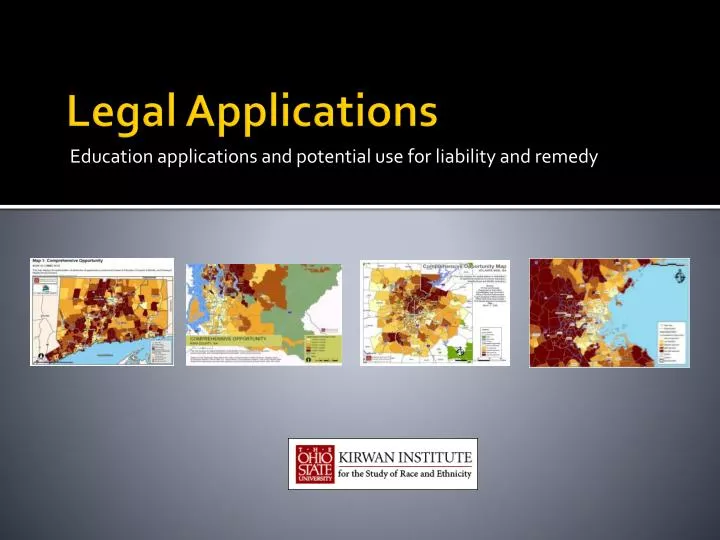
Legal Applications Education applications and potential use for liability and remedy
Opportunity Mapping and Education • Since the racialized nature of opportunity isolation is a spatial phenomena, maps are naturally an effective way to represent it • Maps allow us to understand volumes of data at a glance through layering • Mapping is a very powerful tool in looking at educational inequity & opportunity
School Composition layered over census tract data in Montclair, NJ • Maps illustrate how residential segregation can manifests in schools
Magnet school policy counteracts effects of neighborhood segregation
Opportunity Mapping for Education • Educational outcomes are a product of many inputs. • Using social science research, we can identify factors that correlate with educational performance. • Mapping looks at multiple factors which correlate with educational outcomes and social benefits, in a given neighborhood.
Southwest Central Ohio Southwest Ohio -- Student Disadvantage Southwest Ohio
Opportunity Mapping For Schools • Mapping the geographic distribution of opportunity helps us to evaluate where these opportunity mismatches exist in a community and to design interventions to move people to opportunity • Student assignment policies can be created using these indicators, drawing attendance Zones, boundaries, or through controlled choice plans.
Opportunity Models: Voluntary Integration Plans Using Multiple Indicators (Multi-Factor Approaches)
Berkeley Zones Source: Civil Rights Project at UCLA
Diversity Map Source: Civil Rights Project at UCLA
Three Zone Integration Model: Montclair, NJ GOAL: Each school has diversity of students from each zone, within 5% point deviation of K class zone baseline. K and transfer students are assigned based on parental preference and zone balance.