Download
1 / 19
190 likes | 305 Views
AP Statistics Friday , 25 October 2013. OBJECTIVE TSW investigate how LSRL’s are used in statistics. Hand completed Gummi Bear Assessment to me. EVERYONE needs a graphing calculator . Clear the memory 2 nd + 7 < 1 2. Chapter 5. LSRL.

E N D
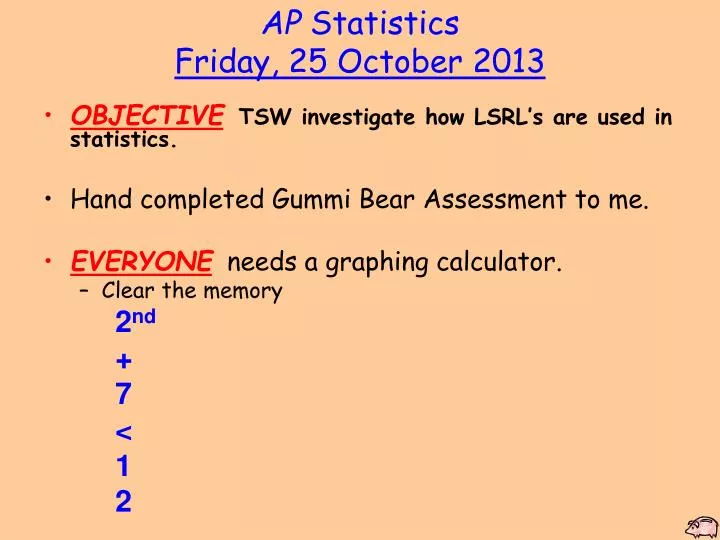
APStatisticsFriday, 25 October 2013 • OBJECTIVETSW investigate how LSRL’s are used in statistics. • Hand completed Gummi Bear Assessment to me. • EVERYONE needs a graphing calculator. • Clear the memory 2nd + 7 < 1 2
Chapter 5 LSRL
x – variable: is the independent or explanatory variable y- variable: is the dependent or response variable Use x to predict y. Bivariate data
(y-hat) means the predictedy b is the slope it is the amount by which y increases when x increases by 1 unit a is the y-intercept it is the height of the line when x = 0 in some situations, the y-intercept has no meaning Be sure to put the hat on the y
The line that gives the best fit to the data set The line that minimizes the sum of the squares of the deviations from the line Least Squares Regression Line(LSRL)
(3,10) y=0.5(6) + 4 = 7 2 – 7 = -5 4.5 y=0.5(0) + 4 = 4 0 – 4 = -4 -5 y=0.5(3) + 4 = 5.5 10 – 5.5 = 4.5 -4 (6,2) (0,0) (Estimate) (0,0) Sum of the squares = 61.25
(3,10) 6 Find y - y -3 (6,2) -3 (0,0) What is the sum of the deviations from the line? Will it always be zero? Use a calculator to find the line of best fit YES The line that minimizes the sum of the squares of the deviations from the line is the LSRL. Sum of the squares = 54
Interpretations Slope: For each unit increase in x, there is an approximateincrease/decrease of b in y. Correlation coefficient: There is a direction, strength, type of association between x and y.
The ages (in months) and heights (in inches) of seven children are given. x 16 24 42 60 75 102 120 y 24 30 35 40 48 56 60 Find the LSRL and r. Interpret the correlation coefficient and slope in the context of the problem.
Correlation coefficient: There is a strong, positive, linear association between the age and height of children. Slope: For each increase in age of one month, there is an approximateincrease of 0.34 inches in heights of children.
The ages (in months) and heights (in inches) of seven children are given. x 16 24 42 60 75 102 120 y 24 30 35 40 48 56 60 Use y-hat to predict the height of a child who is 4.5 years old. Use y-hat to predict the height of someone who is 20 years old.
The LSRL should not be used to predict y for values of x outside the data set. It is unknown whether the pattern observed in the scatterplot continues outside this range. Extrapolation
APStatisticsMonday, 28 October 2013 • OBJECTIVETSW investigate how LSRL’s are used in statistics. • ASSIGNMENT DUE BEFORE YOU LEAVE TODAY • Sec. 5.1: pp. 210-213 (5.1, 5.2, 5.5, 5.6, 5.8, 5.9, 5.12, 5.16) • ASSIGNMENTS DUE THURSDAY, 10/31/13 • WS Regression #1 you will get this today • WS Regression #2 you will get this tomorrow
The ages (in months) and heights (in inches) of seven children are given. x 16 24 42 60 75 102 120 y 24 30 35 40 48 56 60 Calculate x & y. Plot the point (x, y) on the LSRL. Will this point always be on the LSRL? YES
The correlation coefficient and the LSRL are both non-resistant measures.
The following statistics are found for the variables posted speed limit (x) and the average number of accidents (y). Find the LSRL & predict the number of accidents for a posted speed limit of 50 mph.
Reading the LSRL and Correlation Coefficient from Computer-Generated Data Copy this in your notes! Copy this in your notes! The regression output for the association between student scores on Mr. Havens' Statistics tests and time spent studying (in hours) is shown. What is the LSRL? What is the correlation coefficient? Predictor CoefStDev T P Constant 8.30125 2.6354 23.1 0.000 Time30.4902 0.7951 11.2 0.000 S = 2.513 R-Sq = 86.2% R-Sq (Adj.) = 84.2% Positive because the slope is positive
Assignments • Sec. 5.1: pp. 210-213 (5.1, 5.2, 5.5, 5.6, 5.8, 5.9, 5.12, 5.16) black tray • Due beforeyouleavetoday. • WS Regression #1 • Due on Thursday, 10/31/13