Download
1 / 20
200 likes | 303 Views
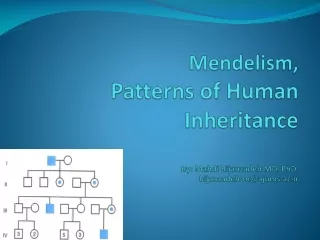
Stability of human V1 retinotopy measured with moving patterns. Junjie Liu David Ress Satoshi Nakadomari Brian A. Wandell. Stanford University. V1 retinotopic organization. Calcarine sulcus. (deg). Occipital pole. (Credit: J.C. Horton). Human V1. Calcarine sulcus. Occipital pole.

E N D
Stability of human V1 retinotopy measured with moving patterns Junjie Liu David Ress Satoshi Nakadomari Brian A. Wandell Stanford University
V1 retinotopic organization Calcarine sulcus (deg) Occipital pole (Credit: J.C. Horton)
Human V1 Calcarine sulcus Occipital pole
FMRI Measurement Coherence 1.0 0.4
Eccentricity Map 20 deg Occipital pole
In Out We confirm data in Whitney et al.(Science, 2003). 1 0 -1 FMRI Signal (%) 1 But, these are merely responses to motion direction changes. 0 -1 0 12 24 Time (sec) Motion-dependent Responses In vs. Out · · · In Out In Out 0 12 24 Time (sec)
Retinotopic representations In vs.Out does not measure retinotopic representations. We measure: In vs. Blank · · · In Blk In Blk
Retinotopic representations In vs.Out does not measure retinotopic representations. We measure: In vs. Blank · · · In Blk In Blk Out vs. Blank · · · Out Blk Out Blk 0 12 24 Time (sec)
Out vs. Blank No significant difference In vs. Blank Coherence: 0.4 1.0
Distance measurement, Bins along calcarine In Blank 2 1 0 FMRI Signal (%) -1 -2 0 12 24 Time (sec) FMRI Amplitude: 2.1% (Dougherty et al., 2003) Quantitative measurements(All voxels in V1)
FMRI Amplitude (%) Amplitude Profile 3 In vs. Blank 2 1 0 0 10 20 30 40 50 Cortical distance (mm) anterior posterior
Stable retinotopic representations: 3 In vs. Blank Out vs. Blank 2 FMRI Amplitude (%) 1 0 0 10 20 30 40 50 Cortical distance (mm)
“shift” model 3 In vs. Blank Out vs. Blank 2 Shift FMRI Amplitude (%) 1 0 0 10 20 30 40 50 Cortical distance (mm)
“edge” model 3 In vs. Blank Out vs. Blank 2 Asymmetrical edge response FMRI Amplitude (%) 1 0 0 10 20 30 40 50 Cortical distance (mm)
In vs. Out: Responses to motion direction changes 3 2 In vs. Out FMRI Amplitude (%) 1 0 0 10 20 30 40 50 Cortical distance (mm)
Three independent measurements 3 In vs. Blank Out vs. Blank 2 In vs. Out FMRI Amplitude (%) 1 0 0 10 20 30 40 50 Cortical distance (mm)
Responses to motion direction changes Differences between retinotopic representations (In vs. Out)>(In vs. Blank) – (Out vs. Blank) 1 (In vs. Blank) – (Out vs. Blank) In vs. Out FMRI Amplitude (%) 0 0 10 20 30 40 50 Cortical distance (mm)
Retinotopy is Stable In vs. Out • We confirm the (In vs. Out) measurements. • Additional measurements (e.g., In vs. Blank), show that retinotopic representations do not shift, or shift very little, with stimulus motion direction. • Hence, this stimulus manipulation has negligible impact on estimated retinotopic maps. In vs. Blank Out vs. Blank