Download
1 / 39
400 likes | 740 Views
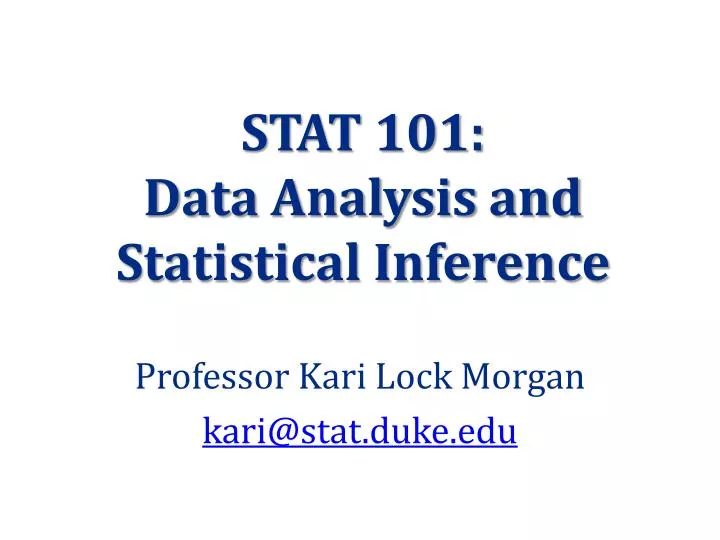
STAT 101: Data Analysis and Statistical Inference. Professor Kari Lock Morgan kari@stat.duke.edu. STAT 101: Day 1 Introduction to Data 1/11/12. Syllabus, Course Overview Why Statistics? Data Cases and Variables Categorical and Quantitative Variables. Section 1.1. Sakai.

E N D
STAT 101: Data Analysis and Statistical Inference Professor Kari Lock Morgan kari@stat.duke.edu
STAT 101: Day 1 Introduction to Data 1/11/12 • Syllabus, Course Overview • Why Statistics? • Data • Cases and Variables • Categorical and Quantitative Variables • Section 1.1
Sakai • Course Website: https://sakai.duke.edu/portal/site/STAT101_Spring12 • Syllabus available online • Lecture slides available online
Required Course Materials • Textbook: Statistics: Unlocking the Power of Data by Lock, Lock, Lock Morgan, Lock, and Lock • To be handed out in lab tomorrow • Clicker: i>clicker • Available at the bookstore, Amazon, or from previous students • $43 at the bookstore, $20 used on Amazon • Need by 1/30 • Calculator • basic calculator is fine • need a non-cell phone calculator
Support • My Office Hours: (in Old Chemistry 216) • 3 – 5 pm Wednesday • 1 – 3 pm Friday • or by appointment • Statistics Education Center: • 4 – 9 pm Sunday – Thursday in Old Chem 211A • Email: kari@stat.duke.edu or your TA
Grade Breakdown Clicker Questions 10% Homework 15% Projects (2 10%) 20% Midterm Exams (2 15%) 30% Final Exam 25% • Grades ≥ 90 are guaranteed at least an A- • Grades ≥ 80 are guaranteed at least a B- • Grades ≥ 70 are guaranteed at least a C- • Grades ≥ 60 are guaranteed at least a D-
Clickers • You need to purchase an i>clicker • Clicker grading will begin 1/30 • Review “Quiz” Questions: • Credit only for answering correctly • Goal: motivate you to keep up with the material • New Questions: • Credit simply for clicking in • Goal: motivate you to think actively about new material as it is being presented
Class Year What is your class year? • First-Year • Sophomore • Junior • Senior • Graduate student
Major Your primary major (or potential future major) best falls under the category… • Natural Sciences • Arts and Humanities • Social Sciences • Math/Statistics/CS • Other
Homework • Weekly homework due • Collaboration and discussion encouraged, but write-up must be done on your own (no copying) • Point of homework: • to LEARN! • to make sure you are keeping up with the material • to prepare you for projects and exams • Graded problems and practice problems • Grading • Graded on a 10 point scale • Lowest homework grade dropped • Penalties for late homework
Projects • Project 1 • individual • confidence intervals, hypothesis tests • written report up to 5 pages in length • Project 2 • group • regression • 10 minute presentation • written report up to 10 pages in length
Exams • Midterm Exam 1: 2/22 and 2/23 • Midterm Exam 2: 3/27 and 3/28 • In-Class Portion: • Closed book: only allowed a calculator and one page of notes prepared only by you • In-Lab Portion: • Open book: allowed any materials (including computer) except communication with other humans • Final Exam: 4/30, 9 – 12 pm • SAVE THESE DATES!
Labs • Labs are on Thursday in Old Chem 01 • Learn how to use statistical software – RStudio • Familiarity with the software will be necessary for homework, projects, and exams • You should have signed up for a section: • 8:45 – 9:35 am (Jessica Feldman) (new section!) • 10:20 – 11:10 am: Yue Jiang • 11:55 – 12:45 pm (Yue Jiang) • 1:30 – 2:20 pm (Michael McCreary) • 3:05 – 3:55 pm (Christine Cheng) • I need your gmail to set up an account
Keys to Success • COME TO CLASS! Come to class on-time and ready to pay attention and think. • COME TO LAB! Attend every lab, and spend time in lab working on statistics. • DO THE HOMEWORK! Try the homework first by yourself, get help where needed, and make sure you understand all the problems by the time you turn it in. • Start the projects early and allow adequate time for working on them. • Give yourself time to prepare a good cheat sheet for exams. Use this preparation to go through the material, and take time to review concepts you don’t understand. • Do lots of practice problems. • Stay on top of the material. Clear up confusion as it occurs.
Why Statistics? • Statistics is all about DATA • Collecting DATA • Describing DATA – summarizing, visualizing • Analyzing DATA • Data are everywhere! Regardless of your field, interests, lifestyle, etc., you will almost definitely have to make decisions based on data, or evaluate decisions someone else has made based on data
Data • Data are a set of measurements taken on a set of individual units • The individual units that measurements are taken on are known as cases • One measurement collected across all the cases is known as a variable • Usually data is stored and presented in a dataset, where each row represents one case, and each column represents one variable
Data US News and World Report National University Rankings Republican Presidential Nomination Polls Duke Basketball Hybrid Cars Stock Market Unemployment Rate Antidepressants and Alzheimer’s
Data Applicable to You • Think of a potential dataset (it doesn’t have to actually exist) that you would be interested in analyzing • What are the cases? • What are the variables?
Kidney Cancer Source: Gelman et. al. Bayesian Data Anaylsis, CRC Press, 2004. Counties with the highest kidney cancer death rates
Kidney Cancer Source: Gelman et. al. Bayesian Data Anaylsis, CRC Press, 2004. Counties with the lowest kidney cancer death rates
Kidney Cancer If the values in the kidney cancer dataset are rates of kidney cancer deaths, then what are the cases? • The people living in the US • The counties of the US
Kidney Cancer If the values in the kidney cancer dataset are yes/no, then what are the cases? • The people living in the US • The counties of the US
Variables:Categorical vs Quantitative • A categorical variabledivides the cases into groups, placing each case into exactly one of two or more categories • A quantitative variable measures or records a numerical quantity for each case.
Categorical Quantitative
Kidney Cancer If the cases in the kidney cancer dataset are people, then the measured variable is… • Categorical • Quantitative
Kidney Cancer If the cases in the kidney cancer dataset are counties, then the measured variable is… • Categorical • Quantitative
Using Data to Answer a Question Let’s Collect Some Data! QUESTION: If you are romantically interested in someone, should you be obvious about it, or should you play hard to get?
Romance Which type of person are you generally more romantically interested in? • Someone who is obviously into you • Someone who plays hard to get
Romance MALES ONLY: Which type of person are you generally more romantically interested in? • Someone who is obviously into you • Someone who plays hard to get
Romance FEMALES ONLY: Which type of person are you generally more romantically interested in? • Someone who is obviously into you • Someone who plays hard to get
One or Two Variables • Sometimes we are interested in one variable, as in whether people prefer obvious romantic interest or hard to get • Other times we are interested in the relationship between two variables, such as • prefer obvious interest or hard to get? • gender
What do you want to know? We’ll do a class survey, collecting data you are interested in. • What data do you want to collect from your peers? • One variable or a relationship between two variables? • What are the variables? • Are they categorical or quantitative?
What do you want to know? • Write a question to measure each variable of interest. Write questions so the resulting data will be accurate and easy to analyze. • Quantitative variable? Give units. • Categorical variable? Make multiple choice and give the possible categories (no more than 5). • Be clear and specific.
Summary • Data are everywhere, and pertain to a wide variety of topics • A dataset is usually comprised of variables measured on cases • Variables can be categorical or quantitative • Data can be used to provide information about essentially anything we are interested in and want to collect data on!
Course Objectives • An understanding of the importance of data collection, the ability to recognize limitations in data collection methods, and an awareness of the role that data collection plays in determining the scope of inference. • The ability to use technology to summarize data numerically and visually, and to perform straightforward data analysis procedures. • A solid conceptual understanding of key concepts such as the logic of statistical inference, estimation with intervals, and testing for significance. • The ability to understand and think critically about data-based claims. • The knowledge of which statistical methods to use in which situations, the technological expertise to use the appropriate method(s), and the understanding necessary to interpret the results correctly, effectively, and in context. • An awareness of the power of data.
To Do • Add your gmail address to the google doc if you haven’t already • Buy a clicker if you don’t already have one • Be on the lookout for data and data-based claims – they are everywhere!