Download

1 / 12
120 likes | 227 Views
Analysis Tools. Analysis Tools Vector Analysis Spatial Analyst Raster Analysis Geostatistical Analyst Interpolation Spatial Statistics Patterns Clusters. Auto-Correlation. Auto – self Correlation - related. Does this signal have auto-correlation?. Signal Components. Random Component.

E N D
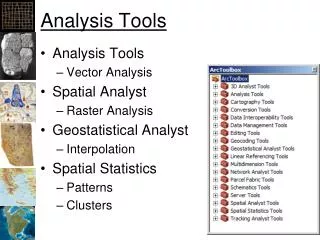
Analysis Tools • Analysis Tools • Vector Analysis • Spatial Analyst • Raster Analysis • Geostatistical Analyst • Interpolation • Spatial Statistics • Patterns • Clusters
Auto-Correlation • Auto – self • Correlation - related Does this signal have auto-correlation?
Signal Components Random Component Uniform
Is Correlation Bad? • Most statisticians see correlation as bad because it can lead to results that are misinterpreted • Spatial auto-correlation can be bad for the same reason so we must detect it • Without spatial auto-correlation, we should not be doing spatial interpolation
First Law of Geography • "Everything is related to everything else, but near things are more related than distant things.“ • Waldo Tobler • (1970) "A computer movie simulating urban growth in the Detroit region". Economic Geography
Measuring Autocorrelation • Moran’s I • Spatial Statistics Tools -> Analyzing Patterns -> Spatial Autocorrelation (Moran’s I) • 0 ~ Random • 1 = Perfect Correlation • -1 = Perfect Dispersion (pattern) ArcGIS Help
Moran’s I Results 0.8 = Spatial Autocorrelation -0.05 = Random -1 = Opposite of autocorrelation
Moran’s I • If the and in the numerator vary in the same way from the mean (positively or negatively), the numerator will be positive. • If and vary in opposite ways from the mean, the numerator will be negative.
Spatial Autocorrelation Game • Northern Kentucky University • http://www.nku.edu/~longa/cgi-bin/cgi-tcl-examples/generic/SA/SA.cgi
Other measures • Geary’s C • Inversely related to Moran’s I • More sensitive to local spatial correlation