Download
1 / 28
280 likes | 399 Views
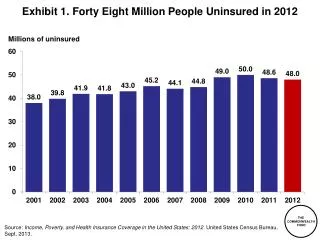
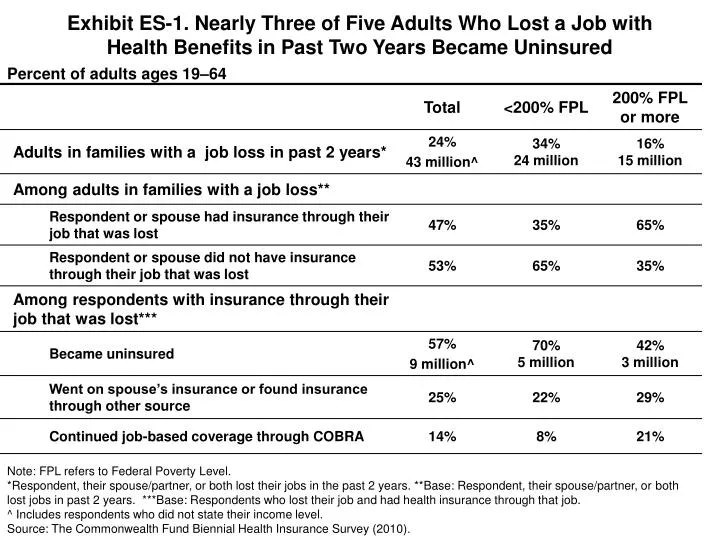
Exhibit ES-1. Nearly Three of Five Adults Who Lost a Job with Health Benefits in Past Two Years Became Uninsured. Percent of adults ages 19–64. Note: FPL refers to Federal Poverty Level.

E N D
Exhibit ES-1. Nearly Three of Five Adults Who Lost a Job with Health Benefits in Past Two Years Became Uninsured Percent of adults ages 19–64 Note: FPL refers to Federal Poverty Level. *Respondent, their spouse/partner, or both lost their jobs in the past 2 years. **Base: Respondent, their spouse/partner, or both lost jobs in past 2 years. ***Base: Respondents who lost their job and had health insurance through that job. ^ Includes respondents who did not state their income level. Source: The Commonwealth Fund Biennial Health Insurance Survey (2010).
Exhibit ES-2. The Individual Insurance Market Is Not an Affordable Option for Many People Note: FPL refers to Federal Poverty Level. *Bought in the past three years. **Respondent rated their health status as fair or poor, has a disability or chronic disease that keeps them from working full time or limits housework/other daily activities, or has any of the following chronic conditions: hypertension or high blood pressure; heart disease, including heart attack; diabetes; asthma, emphysema, or lung disease; high cholesterol. Source: The Commonwealth Fund Biennial Health Insurance Survey (2010).
Exhibit ES-3. The Number of Adults Without Insurance, Forgoing Health Care Because of Cost, and Paying Large Shares of Their Income on Health Care Has Increased, 2001−2010 Adults ages 19–64 *Includes: Had problems paying or unable to pay medical bills; contacted by collection agency for unpaid medical bills; had to change way of life to pay bills; medical bills being paid off over time. **Includes any of the following because of cost: Had a medical problem, did not visit doctor or clinic; did not fill a prescription; skipped recommended test, treatment, or follow-up; did not get needed specialist care. *** Base: Respondents who reported their income level and premium costs for their private insurance plan ****Base: Respondents who specified income level and private insurance premium/out-of-pocket costs for combined individual/family medical expenses. Source: The Commonwealth Fund Biennial Health Insurance Surveys (2001, 2005, and 2010).
Exhibit ES-4. Under the Affordable Care Act, Millions Will Benefit from Newly Subsidized Sources of Health Insurance Adults ages 19–64 Note: FPL refers to Federal Poverty Level. *Includes: Had problems paying or unable to pay medical bills; contacted by collection agency for unpaid medical bills; had to change way of life to pay bills; medical bills being paid off over time. **Includes any of the following because of cost: Had a medical problem, did not visit doctor or clinic; did not fill a prescription; skipped recommended test, treatment, or follow-up; did not get needed specialist care. ***Base: Respondents who specified income level and premium for private insurance plan. ****Base: Respondents who specified income level and premium/out-of-pocket costs for combined individual/family medical expenses. Source: The Commonwealth Fund Biennial Health Insurance Survey (2010).
Exhibit 1. Nearly Three of Five Adults Who Lost a Job with Health Benefits in Past Two Years Became Uninsured Percent of adults ages 19–64 Note: FPL refers to Federal Poverty Level. *Respondent, their spouse/partner, or both lost their jobs in the past 2 years. **Base: Respondent, their spouse/partner, or both lost jobs in past 2 years. ***Base: Respondents who lost their job and had health insurance through that job. ^ Includes respondents who did not state their income level. Source: The Commonwealth Fund Biennial Health Insurance Survey (2010).
Exhibit 2. The Individual Insurance Market Is Not an Affordable Option for Many People Note: FPL refers to Federal Poverty Level. *Bought in the past three years. **Respondent rated their health status as fair or poor, has a disability or chronic disease that keeps them from working full time or limits housework/other daily activities, or has any of the following chronic conditions: hypertension or high blood pressure; heart disease, including heart attack; diabetes; asthma, emphysema, or lung disease; high cholesterol. Source: The Commonwealth Fund Biennial Health Insurance Survey (2010).
Exhibit 3. More than Half of Adults Who Tried Did Not End Up Buying a Plan in the Individual Market Tried, but did not buy individual market insurance 14 million 54% Bought individual market insurance 12 million 46% 26 Million Adults Ages 19–64 Who Tried to Buy Insurance in the Individual Market in the Past Three Years Source: The Commonwealth Fund Biennial Health Insurance Survey (2010).
Exhibit 4. The Number of Adults Without Insurance, Forgoing Health Care Because of Cost, and Paying Large Shares of Their Income on Health Care Has Increased, 2001–2010 Adults ages 19–64 *Includes: Had problems paying or unable to pay medical bills; contacted by collection agency for unpaid medical bills; had to change way of life to pay bills; medical bills being paid off over time. **Includes any of the following because of cost: Had a medical problem, did not visit doctor or clinic; did not fill a prescription; skipped recommended test, treatment, or follow-up; did not get needed specialist care. *** Base: Respondents who reported their income level and premium costs for their private insurance plan ****Base: Respondents who specified income level and private insurance premium/out-of-pocket costs for combined individual/family medical expenses. Source: The Commonwealth Fund Biennial Health Insurance Surveys (2001, 2005, and 2010).
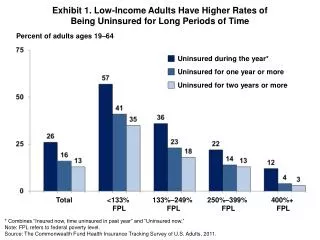
Exhibit 5. Uninsured Rates High Among Adults with Low Incomes, Young Adults, and Hispanics Percent of adults ages 19–64 54 51 41 44 37 28 28 21 17 13 Total 30–49 Black White 19–29 50–64 <100% FPL Hispanic 200% + FPL 100%–199% FPL Race/ ethnicity Poverty Age Notes: Subgroups may not sum to totals because of rounding. FPL refers to Federal Poverty Level. Source: The Commonwealth Fund Biennial Health Insurance Survey (2010).
Exhibit 6. High Out-of-Pocket Spending Climbs Across Income Groups, 2001–2010 Percent of adults ages 19–64 who spent 10% or more of household income annually on out-of-pocket costs and premiums* Note: FPL refers to Federal Poverty Level. *Base: Respondents who specified income level and private insurance premium/out-of-pocket costs for combined individual/family medical expenses. Source: The Commonwealth Fund Biennial Health Insurance Surveys (2001, 2005, and 2010).
Exhibit 7. More Adults Spending Large Shares of Income on Out-of-Pocket Medical Expenses, 2001–2010 Percent of adults ages 19–64 who spent 10% or more of household income annually on out-of-pocket costs and premiums* *Base: Respondents who specified income level and private insurance premium/out-of-pocket costs for combined individual/family medical expenses. Source: The Commonwealth Fund Biennial Health Insurance Surveys (2001, 2005, and 2010).
Exhibit 8. Since 2005, Proportion of Adults with High Deductibles Nearly Doubled Percent of adults ages 19–64* *Base: Those who are privately insured and specified deductibles. Source: The Commonwealth Fund Biennial Health Insurance Surveys (2005 and 2010).
Exhibit 9. Problems with Medical Bills or Accrued Medical Debt Increased, 2005–2010 Percent of adults ages 19–64 Source: The Commonwealth Fund Biennial Health Insurance Surveys (2005 and 2010).
Exhibit 10. Problems with Medical Bills or Accrued Medical Debt Highest for Uninsured Adults Percent of adults ages 19–64 with medical bill problems or accrued medical debt* *Had problems paying medical bills, contacted by a collection agency for unpaid bills, had to change way of life in order to pay medical bills, or has outstanding medical debt. Source: The Commonwealth Fund Biennial Health Insurance Surveys (2005 and 2010).
Exhibit 11. Problems with Medical Bills or Accrued Medical Debt Highest for Adults with Low and Moderate Incomes Percent of adults ages 19–64 with medical bill problems or accrued medical debt* Note: FPL refers to Federal Poverty Level. *Had problems paying medical bills, contacted by a collection agency for unpaid bills, had to change way of life in order to pay medical bills, or has outstanding medical debt. Source: The Commonwealth Fund Biennial Health Insurance Surveys (2005 and 2010).
Exhibit 12. Adults with Low Incomes More Likely to Be Unable to Pay for Basic Necessities Because of Medical Bill or Debt Problems Percent of adults ages 19–64 with medical bill problems or accrued medical debt* *Base: Had problems paying medical bills, contacted by a collection agency for unpaid bills, had to change way of life in order to pay medical bills, or has outstanding medical debt. Note: FPL refers to Federal Poverty Level. Source: The Commonwealth Fund Biennial Health Insurance Survey (2010).
Exhibit 13. Number of Adults Reporting Cost-Related Problems Getting Needed Care Increased, 2001–2010 Percent of adults ages 19–64 Source: The Commonwealth Fund Biennial Health Insurance Surveys (2001, 2005, and 2010).
Exhibit 14.Adults Uninsured for Any Time Had Highest Rates of Cost-Related Problems Getting Needed Care, 2010 Percent of adults ages 19–64 who had any of four access problems*in past year because of cost *Did not fill a prescription; did not see a specialist when needed; skipped recommended medical test, treatment, or follow-up; had a medical problem but did not visit doctor or clinic. Source: The Commonwealth Fund Biennial Health Insurance Surveys (2001, 2005, and 2010).
Exhibit 15. Adults with Low and Moderate Incomes Experienced the Greatest Increase in Cost-Related Problems Getting Needed Care Percent of adults ages 19–64 who had any of four access problems*in past year because of cost Note: FPL Refers to Federal Poverty Level. *Did not fill a prescription; did not see a specialist when needed; skipped recommended medical test, treatment, or follow-up; had a medical problem but did not visit doctor or clinic. Source: The Commonwealth Fund Biennial Health Insurance Surveys (2001, 2005, and 2010).
Exhibit 16. Adults Uninsured During the Year Are More Likely to Not Fill Prescriptions for Chronic Conditions Percent of adults ages 19–64 with at least one chronic condition* who skipped doses or did not fill prescription for chronic condition because of cost Total Uninsured during the year Insured all year *Adults with hypertension or high blood pressure; diabetes; asthma, emphysema, or lung disease; or heart disease, including heart attack, who take prescription medications on a regular basis. Source: The Commonwealth Fund Biennial Health Insurance Survey (2010).
Exhibit 17. Uninsured Adults Are Less Likely to Get Blood Pressure and Cholesterol Checked, 2010 Percent of adults ages 19–64 Note: Blood pressure checked in past year; cholesterol checked in past five years (in past year if has hypertension or heart disease). Source: The Commonwealth Fund Biennial Health Insurance Survey (2010).
Exhibit 18. Uninsured Adults and Adults with Gaps in Coverage Have Lower Rates of Cancer Screening Tests, 2010 Percent of adults * Because of small sample size, “Insured now, time uninsured in past year” and “Uninsured now” are combined. Note: Pap test in past year for females ages 19–29, past three years age 30+; colon cancer screening in past five years for adults ages 50–64; and mammogram in past two years for females ages 50–64. Source: The Commonwealth Fund Biennial Health Insurance Survey (2010).
Exhibit 19. Uninsured Adults Are Less Likely to Have a Regular Source of Care, 2010 Percent of adults ages 19–64 Source: The Commonwealth Fund Biennial Health Insurance Survey (2010).
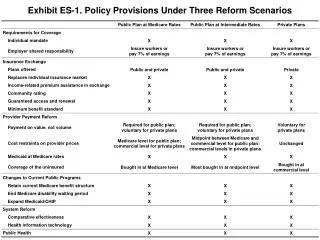
Exhibit 21. Premium and Cost-Sharing Tax Credits Under the Affordable Care Act Note: FPL refers to Federal Poverty Level. OOP refers to out-of-pocket costs. Actuarial values are the average percent of medical costs covered by a health plan. Premium and cost-sharing credits are for silver plan. Source: Federal poverty levels are for 2010; Commonwealth Fund Health Reform Resource Center: What’s in the Affordable Care Act? (PL 111-148 and 111-152), http://www.commonwealthfund.org/Health-Reform/Health-Reform-Resource.aspx.
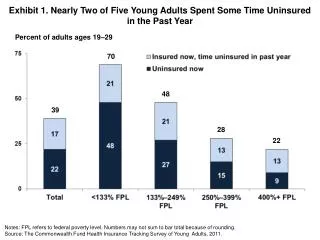
Exhibit 22. Most of the 52 Million Adults Who Were Uninsured During 2010 Will Gain Coverage in 2014 Subsidized private insurance with consumer protections 133%–399% FPL 17 million Medicaid <133% FPL 26 million Nonsubsidized private insurance with consumer protections >400% FPL 3 million Income undesignated 6 million 52 Million Adults Ages 19–64 Who Were Uninsured During the Year in 2010 Note: FPL refers to Federal Poverty Level. Source: The Commonwealth Fund Biennial Health Insurance Surveys (2010).
Exhibit 23. Under the Affordable Care Act, Millions Will Benefit from Newly Subsidized Sources of Health Insurance Adults ages 19–64 Note: FPL refers to Federal Poverty Level. *Includes: Had problems paying or unable to pay medical bills; contacted by collection agency for unpaid medical bills; had to change way of life to pay bills; medical bills being paid off over time. **Includes any of the following because of cost: Had a medical problem, did not visit doctor or clinic; did not fill a prescription; skipped recommended test, treatment, or follow-up; did not get needed specialist care. ***Base: Respondents who specified income level and premium for private insurance plan. ****Base: Respondents who specified income level and premium/out-of-pocket costs for combined individual/family medical expenses. Source: The Commonwealth Fund Biennial Health Insurance Survey (2010).
Exhibit 24. Health Reform Will Reduce Cost-Related Barriers to Accessing Preventive Care Percent of adults ages 19–64* Note: FPL refers to Federal Poverty Level. *Pap test in past year for females ages 19–29, past three years ages 30+; colon cancer screening in past five years for adults ages 50–64; and mammogram in past two years for females ages 50–64; Blood pressure checked in past year; cholesterol checked in past five years (in past year if has hypertension or heart disease). Source: The Commonwealth Fund Biennial Health Insurance Survey (2010).