Download
1 / 15
160 likes | 359 Views
Northern Hemisphere charcoal index. Kelly Hughes 27Nov2012. Proxy for Fire. Transformed Charcoal Influx used for indicating: Wildfires (natural) Deforestation fires (anthropogenic). v. hdg. www.outdoors.fi/destinations/otherprotectedareas/telkkamaki/sights.

E N D
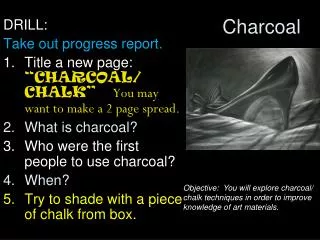
Northern Hemisphere charcoal index Kelly Hughes 27Nov2012
Proxy for Fire • Transformed Charcoal Influx used for indicating: • Wildfires (natural) • Deforestation fires (anthropogenic) v hdg www.outdoors.fi/destinations/otherprotectedareas/telkkamaki/sights en.wikipedia.org/wiki/Wildfire
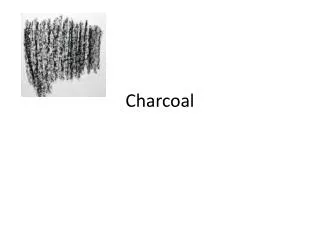
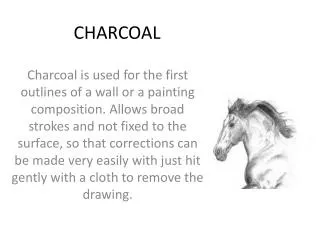
Charcoal • Carbonized material from incomplete combustion of organic matter • Chemically stable & preserves well • Brittle in handling & sample prep • Can be deposited in nearby lakes during/after fire Schlachter, K. J., 2005
Proxy History • Until 1990s: examination of microscopic charcoal in samples prepared for pollen analysis • 3 Limitations: • Pollen samples usually spaced out, leaving unanalyzed sediment • Charcoal particles can fracture during pollen prep, giving a false number of microscopic particles • Source area very large; good for regional picture of past fire, but obscures local picture Schlachter, K. J., 2005
Proxy Today • Contiguous intervals of measurement • Sample prep not as involved as for pollen analysis – less chance of fracture • Bigger charcoal particles are deposited locally vs. distantly deposited microparticles Schlachter, K. J., 2005
Proxy Today • “Macroscopic” charcoal particles analyzed: • > 125 μm (most widely accepted) • Lake sediments • Small, deep, and closed lakes are best • Accumulation of distant fire sources is proportional to surface area of lake • deepest part of the lake is cored because charcoal is focused by currents and sediment slumping • Closed lakes reduce noise caused by fluvial addition/subtraction of charcoal Schlachter, K. J., 2005
Macroscopic • “In one study, charcoal accumulation in small lakes following the 1988 fires in Yellowstone National Park indicated that charcoal particles >125 μm diameter were abundant in sites <7 km from the fire (Whitlock & Millspaugh, 1996)” (Whitlock, C. & Larsen, C., 2002)
Distance of Deposition from Fire Source as a Function of Particle Size Relationship between distance from the base of a fire’s convective column and the amount of charcoal deposited as determined by theoretical models for charcoal particles with diameters of 200, 20 and 5 μm and convective columns with a height of (a) 10 m, (b) 100 m, and (c) 1000 m. (after J. S. Clark, 1988a). Notice a theoretical “skip distance” between the fire and the first deposition of charcoal. Whitlock, C. & Larsen, C., 2002
Methods • Sediment core (piston, percussion, vibracorer) • Lab analysis: identify & quantify charcoal • Sieving (most common): metal mesh sieves (125 μm) • Thin sections • Combustion • Automatic imaging Schlachter, K. J., 2005
Charcoal Index • Charcoal indices are normalized (transformed) charcoal accumulation/influx measurements • Z-scores = (measured sample – mean)/standard deviation • Charcoal indices fall within ~ -0.6 to 0.6; the greater the magnitude of the z-score, the farther from the mean or baseline level of charcoal • (+) more fire than normal • (-) less fire than normal
Marlon, J. R., et al., 2008 • “We find that global biomass burning declined from AD 1 to 1750, before rising sharply between 1750 and 1870. Global burning then declined abruptly after 1870. The early decline in biomass burning occurred in concert with a global cooling trend and despite a rise in the human population. We suggest the subsequent rise was linked to increasing human influences, such as population growth and land-use changes. Our compilation suggests that the final decline occurred despite increasing air temperatures and population. We attribute this reduction in the amount of biomass burned over the past 150 years to the global expansion of intensive grazing, agriculture and fire management.”
Northern Hemisphere vs. global charcoal influx for last 2000 yrs a. Reconstruction of global (red line) and Northern Hemisphere (purple line) biomass burning with confidence intervals based on bootstrap resampling by site. A dashed line is used to represent increased uncertainty in late twentieth century changes in biomass burning. b. Reconstructions of Northern Hemisphere climate with mean values (purple line) of available reconstructions, trend line (dotted line) for first part of record and overlap of uncertainty ranges of ten Northern Hemisphere temperature reconstructions after AD 700 (grey shading).c. World population from the HYDE 3.0 database.d. Atmospheric CO2 concentration.e. Global agricultural land cover30. Marlon, J. R., et al., 2008
Regional Charcoal Indices for past 2000 yrs Changes in biomass burning (as in Fig. 1) with land-cover change30, and proportion of global ice-free land area, for northern extratropics (>30° N) (a), tropics (30° N to 20° S) (b), southern extratropics (>20° S) (c) and the northern high latitudes (>55° N) (d). The composite records are based on at least 10 sites per region and thus should reveal the dominant patterns that reflect processes operating at large spatial scales (see Methods section). Marlon, J. R., et al., 2008
Existing Charcoal Records a. Locations of charcoal records and number of samples over the past 2,000 years (see Methods section). Mean sampling density is one sample per 70 years. b. Distribution of records in bioclimate space showing locations plotted against growing degree-days above 0 °C (an index of effective warmth during the growing season) and the ratio of actual to equilibrium evapotranspiration (an index of effective moisture), with remotely sensed tree cover and modelled biome shown for comparison. Marlon, J. R., et al., 2008
References • Schlachter, K. J. Macroscopic Sedimentary Charcoal as a Proxy for Past Fire in Northwestern Costa Rica. Master’s Thesis, Univ. of Tennessee. (2005) • Whitlock, C. & Larsen, C. Tracking Environmental Change Using Lake Sediments. Developments in Paleoenvironmental Research Vol. 3. pp 75-97. (2002) • Marlon, J. R., et al. Climate and human influences on global biomass burning over the past two millennia. Nature GeoscienceVol. 1. pp 697 – 702. (2008)