Download
1 / 40
400 likes | 519 Views
Convection-Permitting Ensemble Forecasts at CAPS for Hazardous Weather Testbed (HWT). Ming Xue Center for Analysis and Prediction of Storms and School of Meteorology University of Oklahoma mxue@ou.edu August, 2010. ARPS Simulated Tornado. NOAA Hazardous Weather Testbed (HWT).

E N D
Convection-Permitting Ensemble Forecasts at CAPS for Hazardous Weather Testbed (HWT) Ming Xue Center for Analysis and Prediction of Storms and School of Meteorology University of Oklahoma mxue@ou.edu August, 2010 ARPS Simulated Tornado
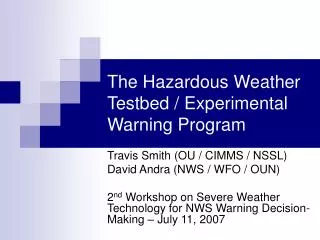
NOAA Hazardous Weather Testbed (HWT) • HWT is a facility jointly managed by NSSL, SPC, and NWS Norman WFO • To accelerate the transition of promising new technologies into forecasting and warning for hazardous weather. • HWT organizes annual Spring Experiment that attracts about 100 researchers and forecasterseach year. • Provides forecasters with a first-hand look at the latest research concepts and potential future products, and immerses researchers in the challenges, needs, and constraints of forecasters.
HWT Spring Experiment Daily Discussions (pictures from spring 2007)
Storm-Scale Convection-Permitting Ensemble and Convection-Resolving Deterministic Forecasting • CAPS/OU provided CONUS-scale 4-km ensemble & 1-2 km high-res forecasts for HWT Spring Experiment since 2007. • NSSL, EMC, NCAR, and GSD provided additional 3-4 km deterministic forecasts.
Scientific Issues to Address • The values and cost-benefits of storm-scale versus coarser-resolution short-range ensembles versus even-higher-resolution deterministic forecast; • Suitable perturbation methods for storm-scale ensemble, e.g., IC, physics, and model perturbations; • Proper handling and use of boundary perturbations; • The value and impact of assimilating high-res data including those from radars; • The most effective ensemble post-processing and most useful products at the convective scales; • The impact of such unique products on forecasting and warning.
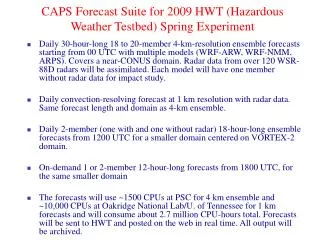
Forecast Configurations of Four Years Spring 2007: 10-member WRF-ARW, 4 km, 33 h, 21Z start time, NAM+SREF ICs. 5 members physics perturbations only, 5 with Phy+IC+LBC perturbations. Single 2 km grid. 2/3 CONUS (Xue et al.; Kong et al.; 2007 NWP conf.) Spring 2008: larger domain, 00Z start, Phy+IC+LBC pert for all. Radar Vr and Z data assimilation for 4 and 2 km grids! (Xue et al.; Kong et al. 2008 SLS Conf.) Spring 2009: 20 members, 4 km, 3 models (ARW, NMM, ARPS), mixed physics/IC/LBCs. Single 1 km grid. Radar DA on native grids. 30 h forecasts from 0Z (Xue et al.; Kong et al. 2009 NWP Conf.) Spring 2010: 26 4-km and one 1-km forecasts. Full CONUS domain. Some members with physics difference only, and 3 with storm-scale and mesoscale IC perturbations only for studying error growth and predictability. About 1.5 months each spring season from mid-April through early June http://forecast.caps.ou.edu.
Configuration of 2007 Ensemble WRF ARW Model at 4 km
Average Domain Total Precipitation Native grids Physics only members All members Ferrier/MYJ Thompson/YSU Stage II Obs WSM6/YSU (Schwartz et al. 2009a,b)
Areal Coverages Native grids WSM6/YSU Ferrier/MYJ Thompson/YSU
Domain-mean ensemble spread - averaged over 38 forecast dates from April 18 to June 7 (Kong et al. 2007) Local Standard Time: 18 00 06 12 18 00
Key Findings from 2007 Experiment • Ferrier/MYJ schemes are associated with greater average precipitation • YSU PBL scheme seems to be associated with relatively less precipitation, on average, in combination with WSM6 or Thompson microphysics • Physics only members are under-dispersive for large-scale fields • For precipitation, physics perturbations seem to generate as much spread as IC/LBC perturbations • There is significant high bias for most members especially on the second day • Convective-allowing ensemble clearly out-performs convection-parameterization ensemble in propagation, ETS, statistical consistency, ROC, etc. (Adam Clark’s talk) • 2 km forecasts didn’t seem to provide much more value than 4 km forecasts for the second day guidance.
Forecast Configurations of Four Years Spring 2007: 10-member WRF-ARW, 4 km, 33 h, 21Z start time, NAM+SREF ICs. 5 members physics perturbations only, 5 with Phy+IC+LBC perturbations. Single 2 km grid. 2/3 CONUS (Xue et al.; Kong et al.; 2007 NWP conf.) Spring 2008: larger domain, 00Z start, Phy+IC+LBC pert for all. Radar Vr and Z data assimilation for 4 and 2 km grids! (Xue et al.; Kong et al. 2008 SLS Conf.) Spring 2009: 20 members, 4 km, 3 models (ARW, NMM, ARPS), mixed physics/IC/LBCs. Single 1 km grid. Radar DA on native grids. 30 h forecasts from 0Z (Xue et al.; Kong et al. 2009 NWP Conf.) Spring 2010: 26 4-km and one 1-km forecasts. Full CONUS domain. Some members with physics difference only, and 3 with storm-scale and mesoscale IC perturbations only for studying error growth and predictability (Xue et al. 2010; Kong et al. 2010 SLS conf.). About 1.5 months each spring season from mid-April through early June http://forecast.caps.ou.edu.
4 km ensemble and 2 km high-res domains 3600 x 2688 km
Movie of 2 km forecast v.s. observations 5 minute time intervals
1-h accumulated precipitation ≥ 0.1in, t=12 h ≥ 0.01in, t=24 h 2008 2008 2007 2007
BIAS comparison1-h accumulated precipitation ≥ 0.1 in 2008 2007
Bias correction based on first 12 days’ biasbased on ranks for each hour (a) Sorted 1 h accumulated precipitation, and (b) differences between members and observation (bias) for the 24 h forecast, averaged over a 12-day period from April 16 to May 7, 2008. (Kong et al. 2008 SLS)
Bias corrected (for the later 15 days) >0.01 in/h >0.1 in/h Probability matching(Ebert 2001) > 1.0 in/h >0.5 in/h
Rank histogram of 1 h accumulated precipitation for 18 h, and 24 h, averaged over 15 days of bias corrected dates 18 h 24h (not much improvement to the reliability though)
ETS comparison1-h accumulated precipitation ≥0.1 in 2008 2007
Forecast Configurations of Four Years Spring 2007: 10-member WRF-ARW, 4 km, 33 h, 21Z start time, NAM+SREF ICs. 5 members physics perturbations only, 5 with Phy+IC+LBC perturbations. Single 2 km grid. 2/3 CONUS (Xue et al.; Kong et al.; 2007 NWP conf.) Spring 2008: larger domain, 00Z start, Phy+IC+LBC pert for all. Radar Vr and Z data assimilation for 4 and 2 km grids! (Xue et al.; Kong et al. 2008 SLS Conf.) Spring 2009: 20 members, 4 km, 3 models (ARW, NMM, ARPS), mixed physics/IC/LBCs. Single 1 km grid. Radar DA on native grids. 30 h forecasts from 0Z (Xue et al.; Kong et al. 2009 NWP Conf.) Spring 2010: 26 4-km and one 1-km forecasts. Full CONUS domain. Some members with physics difference only, and 3 with storm-scale and mesoscale IC perturbations only for studying error growth and predictability. About 1.5 months each spring season from mid-April through early June http://forecast.caps.ou.edu.
ARPS 3DVAR Analysis Grid 1 km grid: 3603 x 2691 x 51 WRF ARW (4 and 1 km) and ARPS forecast grid and common post-processing grid WRF NMM forecast grid
ETS for 3-hourly Precip. ≥ 0.5 infrom HWT Spring Forecast Experiments 2009 (26-day) 2008 (32-day) With radar With radar no radar no radar 12 km NAM 12 km NAM Probability-matched score generally better than any ensemble member 2 km score no-better than the best 4-km ensemble member – may be due to physics 1-km score better than any 4-km member and than the 4 km PM score.
BIAS for 1 h precip of 2009 (24-day average) ≥0.1 inch/h
Reliability diagram for precipitation probability forecast Reliability is improved by using multiple models 12 h forecast of 1 h accumulated precip. ≥ 0.1in
Object-Oriented Precipitation forecasts clusters(by Aaron Johnson) No Radar NMM ARW ARPS NMM ARW ARPS Microphysics PBL 4
Forecast Configurations of Four Years Spring 2007: 10-member WRF-ARW, 4 km, 33 h, 21Z start time, NAM+SREF ICs. 5 members physics perturbations only, 5 with Phy+IC+LBC perturbations. Single 2 km grid. 2/3 CONUS (Xue et al.; Kong et al.; 2007 NWP conf.) Spring 2008: larger domain, 00Z start, Phy+IC+LBC pert for all. Radar Vr and Z data assimilation for 4 and 2 km grids! (Xue et al.; Kong et al. 2008 SLS Conf.) Spring 2009: 20 members, 4 km, 3 models (ARW, NMM, ARPS), mixed physics/IC/LBCs. Single 1 km grid. Radar DA on native grids. 30 h forecasts from 0Z (Xue et al.; Kong et al. 2009 NWP Conf.) Spring 2010: 26 4-km and one 1-km forecasts. Full CONUS domain. Some members with physics difference only, and 3 with storm-scale and mesoscale IC perturbations only for studying error growth and predictability. About 1.5 months each spring season from mid-April through early June http://forecast.caps.ou.edu.
2010 Spring Experiment Domains – Full CONUS NMM 790x999 3DVAR 1200x780 ARW, ARPS & verification 1160x720
ARW member configuration (19) For all ARW members: ra_lw_physics= RRTM; ra_sw_physics=Goddard; cu_physics=none
NMM member configuration (5) For all NMM members: pbl_physics=MYJ; cu_physics=none ARPS member configuration (2) For all ARPS members: no cumulus parameterization Members in red contribute to the 15-member sub-ensemble for post-processed product
12–18Z accumulated precipitation: 18h(June 14, 2010 – OKC Flood Day) SSEF Prob match SSEF mean QPE SREF mean SREF Prob match NCEP 12 km NAM HWT images
12–18Z accumulated precipitation: 18h(May 19, 2010) SSEF Prob match SSEF mean QPE SREF mean SREF Prob match NAM HWT images
Gilbert Skill Scores (ETSs) for CAPS’s SSEF (4 and 1 km) ESRL/GSD’s 3 km HRRR NCEP 12 km NAM From 2010 spring experiment
Referred publications from the data • Schwartz, C., J. Kain, S. Weiss, M. Xue, D. Bright, F. Kong, K. Thomas, J. Levit, and M. Coniglio, 2009: Next-day convection-allowing WRF model guidance: A second look at 2 vs. 4 km grid spacing. Mon. Wea. Rev., 137, 3351-3372. • Schwartz, C. S., J. S. Kain, S. J. Weiss, M. Xue, D. R. Bright, F. Kong, K. W.Thomas, J. J. Levit, M. C. Coniglio, and M. S. Wandishin, 2010: Toward improved convection-allowing ensembles: model physics sensitivities and optimizing probabilistic guidance with small ensemble membership. Wea. Forcasting, 25, 263-280. • Clark, A. J., W. A. Gallus, Jr., M. Xue, and F. Kong, 2009: A comparison of precipitation forecast skill between small near-convection-permitting and large convection-parameterizing ensembles. Wea. and Forecasting, 24, 1121-1140. • Clark, A. J., W. A. Gallus, Jr., M. Xue, and F. Kong, 2010: Growth of spread in convection-allowing and convection-parameterizing ensembles, In press. • Clark, A. J., W. A. Gallus, Jr., M. Xue, and F. Kong, 2010: Convection-allowing and convection-parameterizing ensemble forecasts of a mesoscale convective vortex and associated severe weather. Wea. Forecasting, Accepted. • Coniglio, M. C., K. L. Elmore, J. S. Kain, S. Weiss, and M. Xue, 2009: Evaluation of WRF model output for severe-weather forecasting from the 2008 NOAA Hazardous Weather Testbed Spring Experiment. Wea. Forcasting, Accepted. • Kain, J. S., M. Xue, M. C. Coniglio, S. J. Weiss, F. Kong, T. L. Jensen, B. G. Brown, J. Gao, K. Brewster, K. W. Thomas, Y. Wang, C. S. Schwartz, and J. J. Levit, 2010: Assessing advances in the assimilation of radar data within a collaborative forecasting-research environment. Wea. Forecasting, Accepted.
Web links to papers and realtime products • Xue, M., F. Kong, K. W. Thomas, J. Gao, Y. Wang, K. Brewster, K. K. Droegemeier, X. Wang, J. Kain, S. Weiss, D. Bright, M. Coniglio, and J. Du, 2009: CAPS realtime multi-model convection-allowing ensemble and 1-km convection-resolving forecasts for the NOAA Hazardous Weather Testbed 2009 Spring Experiment. 23nd Conf. Wea. Anal. Forecasting/19th Conf. Num. Wea. Pred., Omaha, NB, Amer. Meteor. Soc., Paper 16A.2. • Kong, F. M. Xue, K. W. Thomas, J. Gao, Y. Wang, K. Brewster, K. K. Droegemeier, J. Kain, S. Weiss, D. Bright, M. Coniglio, and J. Du, 2009: A realtime storm-scale ensemble forecast system: 2009 spring experiment. 23nd Conf. Wea. Anal. Forecasting/19th Conf. Num. Wea. Pred., Omaha, NB, Amer. Meteor. Soc., Paper 16A.3. http://forecast.caps.ou.edu
Resources $125K/year CSTAR funding! NSF supercomputers. 18,000-core Cray XT-4 at NICS ~5 hours a day in 2010 All data archived (TBs/day) – need to be fully exploited Collaboration in analyzing the data welcome.
Future Plan (in CSTAR Renewal Proposal) • General direction: more emphasis on aviation weather (e.g., 3 weeks in June + May), more runs/day, shorter forecast ranges, fine-tuning of ensemble design, • Multi-scale IC perturbations, ETKF perturbations, EnKF-based perturbations • Land surface perturbations, • Possible additional LBC perturbations, • More intelligent choices of physics suites • Addition of COAMPS • Improved initial conditions via more advanced data assimilation • Possible GSI analyses with target HRRR set up and other more experimental configurations/schemes • Possible hybrid ensemble-GSI analysis • Possible EnKF analysis • Post-analysis and probabilistic products: e.g., calibration, bias removal, detailed performance evaluation, cost-benefit/trade off assessment, effective products for end users (e.g., those for aviation weather, severe storms); • Integration/coordination with national mesoscale ensemble efforts (DTC/DET collaborations).
Probabilistic Warn-on-Forecast for Tornadoes - The ultimate challenge – need ~100 m resolution Radar and Initial Forecast at 2100 CST Radar at 2130 CST: Accurate Forecast Probabilistic tornado guidance: Forecast looks on track, storm circulation (hook echo) is tracking along centerline of highest tornadic probabilities An ensemble of storm-scale NWP models predict the path of a potentially tornadic supercell during the next 1 hour. The ensemble is used to create probabilistic tornado guidance. Most Likely Tornado Path Most Likely Tornado Path Developing thunderstorm 30% 30% 50% 50% 70% 70% T=2200 CST T=2200 CST T=2150 T=2150 T=2140 T=2140 T=2130 T=2130 T=2120 CST T=2120 CST (Stensrud, Xue, et al. BAMS 2009) NSSL Warn on Forecast Briefing March 5, 2007
The Computers Used NICS, Kraken (~99K cores) For 2010: Exclusive use of a 18,000-core Cray XT-4 at NICS/University of Tennessee 6 hours a day Thanks! PSC (4K cores)