Download
1 / 26
260 likes | 499 Views
A Study of Non Real Time Radio Bearer Packet Data Performance in UMTS Radio Access Network. Seema Gyanwali Supervisor: Professor Sven Gustav Häggman Instructor: Janos Gyori 12.10.04. Contents. Introduction Goals Background Measurement Introduction Measurement Method Results Conclusions.

E N D
A Study of Non Real Time Radio BearerPacket Data Performance in UMTSRadio Access Network Seema Gyanwali Supervisor: Professor Sven Gustav Häggman Instructor: Janos Gyori 12.10.04
Contents • Introduction • Goals • Background • Measurement Introduction • Measurement Method • Results • Conclusions
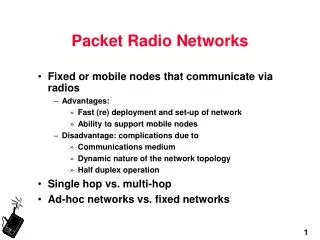
Introduction • Knowledge of Packet data transmission in the radio interface of UMTS and factors involved in its transmission is not widely investigated and documented. • Packet data performance is a broad concept which can be investigated from different perspectives for different purposes. • This thesis studies the radio network parameters’ performance in WCDMA network for visualizing and optimizing packet data transmission. • This work will help in the following aspect: • Validation of network design • Validation of Planning assumptions such as • cell range • maximum acceptable load • Dimensioning • Iub capacity, • Node B capacity • Performance Optimisation • Radio coverage optimization • Analysis of radio link power and network tuning • Tuning of advanced features e.g. load and service tuning • Find out some statistics and the trends for reference purposes • This work was done in Nokia Networks, Espoo.
Goals of the Thesis Work The goal of the thesis is to: • Conduct a drive test measurement in WCDMA test network • Collect the performance data from the drive test • Perform statistical analysis on the collected data to verify the packet data performance in different radio conditions • Evaluate the throughput and maximum radio link power for different bearer services • Analyse the coverage area for different bearer services Scope: • Scope of the work is limited to radio interface of WCDMA network only, it is not a study for end to end performance
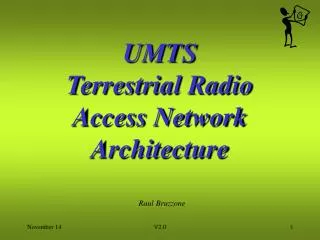
Uu Node B Iu PLMN, PSTN, ISDN USIM RNC MSC/VLR GMSC Node B Iur Cu HLR Iub Node B Internet ME RNC SGSN GGSN Node B UTRAN UE CN External Networks Network Elements Thesis work analysis in the Uu interface
UMTS Qos Traffic Class • Conversational class • Streaming class • Interactive class • Background class
Measurement Area and Route Overview of the test network
Test UE Test UE FTP Server FTP Server Iu Iu PS PS - - Iub Iub 3G 3G - - RNC RNC RNC RNC 3G 3G - - SGSN SGSN GGSN GGSN GGSN GGSN GGSN FW FW 3G 3G - - SGSN SGSN GGSN GGSN FW FW 3G 3G - - SGSN SGSN SGSN SGSN Node B Node B TOM TOM 3G Nethawk 3G Nethawk Analyzer Analyzer Logging Tools • Nokia 3G test mobile • TOM • A portable engineering tool, which is installed in the laptop to measure and monitor the air interface of WCDMA wireless network • Nethawk Analyzer • Real time monitoring tool to measure the Iub interfac
Measurement Method • A packet data call was established • FTP download of a large file (100 Mb) was performed • The call was maintained while driving from good coverage area to bad coverage area • Measurements were repeated for different radio bearers (384 kbps, 128kbps, 64kbps services) • Parameter: • MaxBitRateDLPSNRT • Analyzing Tools: • Actix Analyzer • Excelsheet
Throughput and RSCP for 384 kbps RSCP: received power on one code measured on the primary CommonPilot Channel
Throughput and EcNo for 384 kbps EcNo: Received energy per chip divided by the power density in the band. It gives the quality of the common pilot channel signal.
Downlink Power for Different Radio Bearer Services Max power for 384 kbps service Max power for 128 kbps service Max power for 64 kbps service
Downlink Power for Different Radio Bearer Services For Non Real Time Traffic Ptx_max_rl = min{Ptx_CPICH-CPICHtorefRABoffset + SF_adjustment, Ptxtotalmax-PTxDPCHmax} SF_adjustment = Eb/No . Bit rate Eb/No ref.Bit rateref
Conclusion Packet Data performance in different radio condition is verified. And the conclusion is: • The max bit rate for different bearer services cannot be achieved in the whole range of the cell • The average throughput value for each service profile is obtained which is below the nominal value due to the TCP features • In poor coverage area the RSCP and EcNo decreases and at a certain point the throughput starts to degrade because the DL radio link power reaches the maximum and it becomes difficult to maintain the quality • The RSCP and EcNo value, when the throughput starts to collapse for each service profile, is found out which is quite optimistic due to the fact that there were no other load in the cell and in the neighboring cell • Different bearer service has different coverage area • The maximum downlink radio link power is different for each bearer services and the power reaches the maximum at different points