Download
1 / 15
150 likes | 273 Views
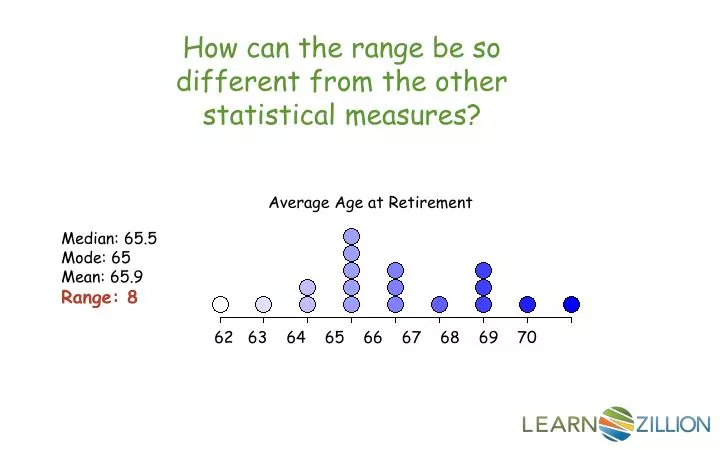
How can the range be so different from the other statistical measures?. Average Age at Retirement. 62 63 64 65 66 67 68 69 70. Median: 65.5 Mode: 65 Mean: 65.9 Range: 8. In this lesson you will learn how to describe the distribution of data by using the range.

E N D
How can the range be so different from the other statistical measures? Average Age at Retirement 62 63 64 65 66 67 68 69 70 Median: 65.5 Mode: 65 Mean: 65.9 Range: 8
In this lesson you will learn how to describe the distribution of data by using the range.
A line plot helps you read data quickly. Age at First Vacation 5 6 7 8 9 10 11 12 13 14 15
In real life people might say, “The students’ ages range from 10 to 13.” In the math world the range is a single number.
The range of a data set can be found by subtracting the smallest number from the largest number in the set.
How old were you when you lost your first tooth? 6, 4, 6, 7, 5, 5, 6, 5, 5, 6 4 5 6 7 1 2 3 4 5 6 7 8
Average Age at Retirement How can the range be so different from the other statistical measures? 62 63 64 65 66 67 68 69 70 Median: 65.5 Mode: 65 Mean: 65.9 Range: 8
How many pets do you have? 2, 1, 0, 10, 1, 2, 1, 2, 1, 2 0 1 2 3 4 5 6 7 8 9 10
How tall are the people in this room (in inches)? 57, 60, 55, 57, 58, 56, 55, 80 Height of people in this room (in inches) 54 56 58 60 62 64 66 68 70 72 74 76 78 80
Describing Spread 15 960 0 50 100 150 200 250 300 350 400 450 500 550 600 650 700 750 800 850 900 950 1000 House Numbers on Lake Avenue 4 5 6 7
In this lesson you have learned how to describe the distribution of data by using the range.
What is the range of this data? How does it help describe the distribution? 0 1 2 3 4 5 6 7 8 9 10 Favorite Number between 0 and 10.
Look online or in a newspaper for sports statistics in tables. What is the spread? How does this help describe the distribution?
What is the range of this data? How does it help describe the data? 0 5 10 15 20 25 30 35 40 45 50 Pennies brought to bank for change
What is the range of this data? How does it help describe the data? How old were you when you first went on vacation? 5 6 7 8 9 10 11 12 13 14 15