Download
1 / 40
400 likes | 504 Views
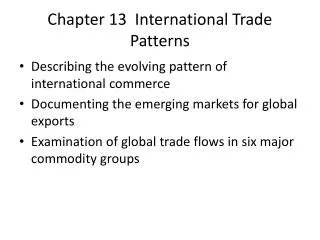
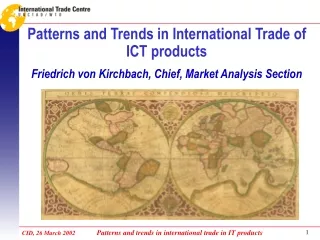
Patterns and Trends in International Trade of ICT products Friedrich von Kirchbach, Chief, Market Analysis Section. WTO. UNCTAD. ITC.

E N D
Patterns and Trends in International Trade of ICT products Friedrich von Kirchbach, Chief, Market Analysis Section
WTO UNCTAD ITC Global forum for the treatment of development and the interrelated issues of trade, finance, services, investment, technology and insti-tutional aspects of enterprise development involving govern-ments and non-governmental actors. Platform for negotiating multilateral trade rules and commitments, monitoring implementation and settlement of disputes. Technical cooperation arm of WTO and UNCTAD for operational enterprise-oriented capacity building, for trade promotion and export development.
PRIMARY DATA DETAILED DATA ON THE WEB ANALYTI-CAL DATA ON WEB SINGLE-CLIENT STUDIES TRADE FLOWS Full range of tools MARKET ACCESS DATA BUSINESS INFORMATION Inquiry Reply Service ITC’s market analysis tools Part III - Overview of ITC ’s Market Analysis Tools (www.intracen.org/mas)
World market for ICT products in 2001: Euro 2.2 trillion *incl. Eastern Europe Source: EITO Update 2001
World-wide ICT markets annual growth by region, 2000-2002, % Source: EITO Update 2001 Market value 2001: 2.151 billion Euro
Positive International demand: World Trade Growth Negative Losses Gains National Export Growth vs. International Demand Underachievers Champions Losers in declining markets Achievers in adversity Change in world market share
Note: the area of the circles correponds to the export value of the product group for ITC partners. See explanatory sheet for details. Source: ITC calculations based on COMTRADE statistics. ITC
Share of developing countries in world trade of ICT products: • 25 % of exports • 35 % of imports
Assessing national export performance and competitiveness by major sectors: Trade Performance Index
ITC’s home page www.intracen.org Country Approach
Country MAPs • Trade Performance Index • National Export TradeMaps • National Import TradeMaps • Trade Simulation Model TradeSim • Reliability of trade data • Environmental TradeMaps • Protection in partner countries by major sectors
Trade Performance Index The Trade Performance Index comprises a set of 24 quantitative indicators benchmarking the export performance of 184 countries. The TPI: • ranks 14 different product sectors in each country • summarizes performance indicators into a Current Index and a Change Index • sheds light on comparative and competitive advantages • positions the major export sectors of all countries on a global competitiveness ladder.
Indicator Value of net exports, 2000 Unit US$ b Value -21 Rank 92 Per-capita exports, 2000 US$/ inhabitant 323 23 Share in world market, 2000 Per cent 15 1 Product diversification No of major products 8 50 Market diversification No of major exp.markets 12 13 21 Trade Performance Current Index: Electronics, USA in 92 countries Current Index:
Trade Performance Index USA Large sector Electronics Small sector 92th (worst) 1st (best) Ranking among 92 countries Ranking of international competitiveness in terms of static indicators (Current Index) and dynamic indicators (Change Indicator) 21
Indicator Absolut change of world market share 96-00 Unit per centage points p.a. Value 0.36 Rank 4 Change in world market share: Electronics, USA in 92 countries Ranking: Change in world market share 4
Large sector Electronics Small sector 92h (worst) 1st (best) Ranking among 92 countries Trade Performance Index USA Ranking of international competitiveness in terms of static indicators (Current Index) and dynamic indicators (Change in world market share) 21 4
Trade Performance Change Index: Electronics, USA Indicator Change of world market share 96-00 Unit per cent p.a. Value 2.87 Rank 32 in 92 countries Trend of import coverage by exports per cent p.a 2 39 correlation 39 Matching dynamics of world demand Change in product diversification concentrationmeasures 75 Change in market diversification concentration measures 58 Change Index: 50
Trade Performance Index USA Large sector Electronics Small sector 85th (worst) 1st (best) Ranking among 85 countries Ranking of international competitiveness in terms of static indicators (Current Index) and dynamic indicators (Change Index) 20 4 Change Index: 50
electronics • A. Changes in trade performance in absolute terms: • change in world market share: • Taiwan realized the largest annual increase 96/00 in percentage points, and became the 4th largest exporter in 00 • change in Current Index 00 to 99: • Overall continuity, exceptions: Singapore from 13 to 5 and France from 2 to 10
electronics • B. Changes in trade performance in relative terms: • total and decomposed relative change in world market share 96 to 00: • Poland, with exports of $ 2b in 2000, increased its world market share by an annual 1.6%, consisting of: • + 10.6 in competitiveness • - 3.0 in initial product specialization • - 1.8 in initial market specialization • - 4.2 in adaptation
electronics • B. Changes in trade performance in relative terms: • Change Index: • Philippines comes out on top of the ranking based on five change indicators, due to • - a 23 % annual increase of its market share reaching 3.2 % of the world market • - the best ranking concerning specialization in the most dynamic products in the sector
Results in ICT report • Current role of developing cntries in trade: • most pronounced in office machinery and electronic components (in both sectors 5 Asian NIEs among top ten according to Current TPI) much more limited role of Europeans (only UK among the top eight) • much less in telecommunications equipment (2 NIEs in top 10) • no developing countries in electrical machinery
Results in ICT report • Changing role of developing countries: • among top ten countries in terms of Change Index for the four sectors electronic components, computers, telecommunications equipment and electrical machinery, most frequently mentioned are: • Asian developing countries (14 times) • Eastern Europe & Russia (11 times) • Latin America (4 times) • Africa (1 time)
Detailed assessment of national trade performance for specific products: Interactive TradeMap
ITC’s Interactive TradeMap provides... • Value of exports and imports • Quantities • Growth trends • Market shares • Rankings according to a variety of criteria • Tariffs and non-tariff barriers For each product and partner country in a fully interactive environment
How? Interactive TradeMap Based on COMTRADE - the United Nations Statistics Division database - covering 90% of world trade reported by nearly 100 trading nations - tariff and NTB data provided by 145 countries directly or through UNCTAD Covers over 5,000 Harmonized System products -200 countries and territories - includes non-reporting countries using mirror statistics Web access with username and password
Limitations • Trade statistics of uneven quality • Services not covered • Up-dating twice a year – time lag between one and two years • Product detail only to the HS 6-digit level
Enhancing the transparency of market access barriers for trade policy makers and the business community: Market Access Maps
Basic Features of Market Access Maps Coverage (four dimensions): • 145 importing markets • 220 exporting countries • Products at the tariff line level • Protection instruments: MFN ad-valorem and specific tariffs, tariff quotas, anti-dumping duties, prohibitions, technical and environmental norms
Basic Features of Market Access Maps Analytical functions: • Takes into account all regional trading arrangements • Calculates ad-valorem equivalents (AVEs) for combination of ad-valorem and specific tariffs and tariff quotas • Allows for aggregation to any level using trade weighting based on imports of reference groups of countries to avoid distortions
Program thrust • Building national capacities to increase awareness and e-competence of SME managers in e-trade • Developing e-products and services for SME’s and trade support institutions • Securing exchange and cooperation among national and international e-trade related initiatives
Components for building national capacities • E-trade bridge kick-off meeting • Strategy designers and managers training programme • National training capacity building programme
Kick-off Meeting Phases Kenya Kick-off Meeting • National e-trade bridge task force creation • Preparation of e-map and e-balance sheet • Stake-holders deliberations • National e-bridge platform installation • E-action plan preparation • Win With the Web program launching • WWW task group training • SMEs screening • Awareness campaign launching • "Best practice" cases promotion
ITC PRACTICAL GUIDES Answering Exporters’ Frequently Asked Questions • Trade Secrets: The Export Answer Book • How to Approach Banks: A guide for exporters • Secrets of Electronic Commerce: A guide for SMEs • Trade in Services: An answer book for SMEs • International Trade Rules: An answer book for SMEs • Export Quality Management: An answer book for SMEs
For more information, please contact us at ITC www.intracen.org or under MAS@intracen.org Thank you for your attention.