Download

1 / 28
280 likes | 391 Views
Quality Control and Analysis of Surface Meteorological Station Data. Kewen Xu Guixiang Zhao. ( National Climate Observation Station of Taiyuan , No568,pingyang Road, Taiyuan 030006 , Shanxi ,P.R.China ). E-mail : xu411-wang921@163.com. Abstract:.

E N D
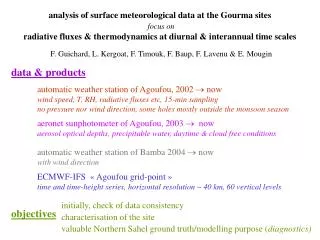
Quality Control and Analysis of Surface Meteorological Station Data Kewen Xu Guixiang Zhao ( National Climate Observation Station of Taiyuan,No568,pingyang Road, Taiyuan 030006 , Shanxi ,P.R.China ) E-mail:xu411-wang921@163.com
Abstract: • Using conventional observations of automatic and manual weather station from January 2003 to September 2004 (temperature, pressure, relative humidity and soil temperature from 0 cm to 320 cm ),a contrast analysis was gave. The results show that :observational errors of temperature, pressure and soil temperature from 40cm to 320 cm are relatively small ,while relative humidity, soil temperatures from 5 cm to 20 cm and ground temperature are greater . There are many factors that caused data differences between automatic and manual observation, including different measure principles and observation method, different measure time level, different environment, and so on. It can provide basis for continued use of data observed by automatic station. A real meteorological data quality control is based on right way and fit method. • Key words: automatic weather station, manual weather station, comparative analysis ,surface meteorological observation method
1 Introduction • Our station is one of the global observation systems. During the observatory activity, we learned how to read and record measurements with each of the weather instruments that were built. Now, we are using instruments to record automatic data and comparing with manual data together and we are familiar with how to use the automatic weather data ,so that we will be able to read, and record the weather Information automatically, access archived data for previous days. Using ground measurement data, we gave this study.
2 data collection and observe processing. • Manual observation measure method is necessary to adjust processing. soil temperature should be put in the first step from deep to shallow (soil temperature differs from temperature, it changes slowly, but ground temperature changes rapidly .In the second step we can observer snow cover or rain, cloud cover, visual range, state of the ground and special phenomena, precipitation amount, and atmospheric phenomena .In the third step obtains temperature, humidity, wind speed and direction, pressure, which are made every hour. When the data loss at some fully automatic stations, it will replace of manual thermometer .the observation should be made in as short a time as possible at the exact hour. The standard of time any observations recorded by clock time have been entered. It is reason has differed from real time observations.
3 contrast and analysis of meteorological data • Difference between data observed by automatic station and manual station were discovered .The data used in this paper are that: air pressure, temperature, relative humidity and soil temperature at observation stations of Taiyuan city from January 2003 to September 2004 .
3 contrast and analysis of meteorological data • Casual departure X i:Observing element deviation value between automatic observe and manual observe • Average departure X:Average casual departure monthly • X= [∑(Xmanual-Xautomatic)] /n
3.1 Air Pressure • Figure1, the left stands for average departure of pressure, our reading values are mostly lower and the mean error (during January 2003 to September 2004) is estimated to be about 0.6 hPa, the maximum is about 0.8 hPa ,and the minimum if about 0.1 hPa. This error is gradually increasing, and has been remarkably stable, except that monthly data in April appears to be somewhere greater. It will remain the same value after that.
3.2 Temperature • Figure2, below shows, is a graph showing automatically temperature and manual surface observations collected during January 2003 to September 2004 ,it always showed consistent values with thermometers and sensor comparative analysis. Temperature readings collected by automatable surface observations are mostly low in winter other than temperature collected by manual surface observations are low in summer .The mean departure is estimated to be about -0.5-0.1℃, with a maximum casual departure of 1.5℃ when temperature changes rapidly. Even if air temperature is consecutive measured at 1 hour apart , finding this error is not easy. For an example , September and October 2003 outliers, mean departure reached separately 3.9℃ and 1.17℃ because automatically collecting sensor was break out. It is very difficult to find it. Casual departure is irregularly up and down on occasion.
3.2 Temperature • The other test methods are that using analysis of regression and analysis of variance .It shows a choosing diffident 4day for the 24—hour period temperature between -20℃~25℃, consistency checks data between automatic weather station and manual weather station. As an example, we calculated variability of temperature of representative four part daily ,the period of 4 January ,11 January, 14 February ,15 April . • Testing normal distribution sample between automatic weather station and manual weather station ,the data regarded has no significant difference on level of significance=0.05, lining up regression equation and analysis of regression.
3.2 Temperature Sample test : y shows automatic weather station data x shows manual weather station data Variance : S2x expresses automatic weather station data S2y expresses manual weather station data
3.2 Temperature We have to use Fig.3.comparate analysis of variable temperature -20℃~-10℃between automatic weather station and manual weather station . Hypothesis testingδ2manual=δ2automatic S 2manual=11.29 S2automatic=9.99 δ2manual =10.82 δ2automatic=9.55 Sample number: n1=n2=24 level of significance=0.05α=0.05 F distribution, F=1.13 F0.05(23 , 23)=2.01F0.95(23 , 23)=0.49 When δ2manual >δ2automatic, F≤F1-α(n1-1 n2-1)or F≥Fα(n1-1 n2-1)is rejection region 0.49≤(F=1.13)≤2.01 The examining value of F are greater than F0.05, hypothesis is regarded outside rejection region, δ2manual=δ2automatic, Two aspects overall amounts have homogeneity of variance regression equation:y = - 0.60 + 0.93x Correlation coefficient r = 0.994
data time Sx2 Sy2 δx2 δy2 F r regression equation 4 January 11.29 9.99 10.82 9.55 1.13 0.994 y=-0.60+0.93x 11 January 26.83 27.46 25.70 26.32 0.98 0.999 y=0.29+1.01x 14 February 31.02 30.58 29.70 29.27 1.01 0.999 y=0.08+0.99x 15 April 40.83 41.09 39.19 39.14 0.99 0.999 y=-0.02+1.00x 3.2 Temperature • table1:Discriminate analysis four section temperature data get correlation coefficient and regression equation of automatic weather station and manual weather station
3.3 Humidity • Figure 7 that humidity varies between automatic and manual station from January 2003 to September 2004.There have two high period the monthly average consistent values relative humidity is expressed as percentage varying from March to October, the lowest in November-January .The relative humidity runs instability, especially increasing the influence of spring and autumn. The highest average consistent values is 4 % in April 2003 and June 2003. Hygrometers, when checked during a stable period, proved to be quite reliable; their errors, usually around 2%-3%, gets bigger for either extremely low or high values. The hygrometer has been substituted,as it was reading about 3% less than very high humidity . The role of the low humidity and the high humidity cases investigate Fig 7.
3.4 Soil temperature at a range of depths Here, the data shown for past years have been collected from the 1st of January until the 31st of December of a year. Based on the analysis of the characteristics of surface temperature observation, a method of standard comparative for surface temperature observation data was presented 2003.
3.4 Soil temperature at a range of depths The steps of this method are introduced in detail. The method is essentially the manual checking . In order to gather information regarding current baseline algorithms used by arithmetic departure mean. Data processing, it provides a range of soil temperature at two depths distributions Fig. 8 and Fig. 9.Comparison value is negative number, expressing automatic data is bigger than manual. Otherwise it is the same. Manual data which can differ from one to the other is due to a small difference in the timing of automatic data received. Two depths comparison value are more negative number -1.0℃ from January to September in 2003.The tendency of negative number about 5cm is increasing. When surface has snow covered and using different method ,actually casual departure reaches approximately 10.0℃ sometime. We will also measure the snow thickness at some of these sites.
3.4 Soil temperature at a range of depths We will use our calibrated numerical models investigate the sensitivity of permafrost temperatures to different scenarios of future climatic change. The first national-level observation is about our experience to reach target of the project. Casual departure of surface temperature is unstable because surface temperature changes rapidly. Surface temperature observation has natural reasons; because the change of sounding environment is different, so using kinds of analyzing methods. The changing of meteorological sounding deep data maintains extremely high stability and seemly deeper more stable.
4 Advanced • The fact is that automatic station will be used more and morewidely. Observatory quality will improve continuously and no observers can be available. Remote sensing is the science of detecting and measuring kind of variables (e.g. temperature and air pressure, humidly and soil temperature) without coming into contact with observing meteorological phenomena of surface observation. (etc. Light fog and haze). Meteorological phenomenon has very complex. Meteorological phenomena are in most cases obtained by observers at stations. Until recent years all surface observing have been performed manually; the observer reads the instruments, makes visual estimates of visibility, cloud, present weather and the state of ground, records the observation on paper, this paper was to do a case study based on operational experience.
4 Advanced • An additional point the prevailing visibility observe in most cases use traditional methods were discussed .visibility observations made by human observer and must cover a range up to 10 km. We confused that the approach is made somewhere between 0.1km and 10km above the ground like seem phenomena .Typically recently there has been some renewed interest in distinguish between light fog, smoke and haze. Visibility will be mixed up and use the existing systems by a better way. It is useful to know that visibility observations can be assisted by visibility sensors. we will focus on this point .It is necessary to clearly describe its feature with different conditions.