Download

1 / 21
210 likes | 367 Views
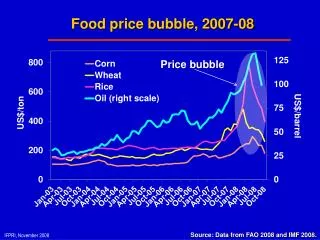
Japanese Asset Price Bubble. Jerry Chiu Jiehong Kong. Frank Murguia Carlos Nuñez. Foundation for Bubble. Japanese industries devastated by WWII Post WWII policies & tariffs encourage savings by the population Results: Trade surplus Yen ( ¥ ) appreciates

E N D
Japanese Asset Price Bubble Jerry Chiu Jiehong Kong Frank Murguia Carlos Nuñez
Foundation for Bubble • Japanese industries devastated by WWII • Post WWII policies & tariffs encourage savings by the population • Results: • Trade surplus • Yen ( ¥ ) appreciates • Domestic companies find it easy to obtain money • Japanese products cost less to manufacture
Inflating the Bubble • Opportunity fuels real estate bubble in late 1980s • Similar to current US bubble? • Japanese bubble was centered around commercial real estate • US bubble chiefly involved housing
Recipe for Disaster • The Plaza Accord (depreciate USD against ¥ and DM) • Affects exports • Econ growth 4.4% (1985), 2.9% (1986) • Bank of Japan (BOJ) responds and cuts discount rate from 5% to 2.5% • Monetary policy provides air for the bubble
Zenith • Ginza district (Tokyo), prime property values at USD 139,000 per sq ft • Tokyo Stock Exchange (Nikkei stock index/Nikkei 225) hits record high ¥38,957.44 in fourth quarter 1989
Downturn • BOJ realizes the bubble and responds by tightening monetary policy, and from 1989 to 1990 discount rates are increased five times to cap at 6% • Market collapses shortly afterward as a result of lack of investor confidence
The Wounded Nikkei • The Japanese stock market index • Peaked at ¥40,000 in 1989 • Dropped to below ¥15,000 in 1992 • There were periods in the 1990s when it rose in anticipation that the market would bounce back, but the harsh reality is that the Nikkei 225 has been in steady decline even to this day. • Real estate • From 1991 – 1998 property lost 80% of its value
Bank Problems • The banking system was heavily regulated, thus considered institutionally stable • In 1985 the deregulation of interest rates on deposits began. Prior to that bank were not allowed to pay interest on deposits • People invested in the stock market & foreign investments • Deposit Insurance Corporation, which played a supervisory role in the economy was mishandled • Confidence/naiveness turned into a liability upon market collapse
The Hangover • Real GDP (RGDP) would flounder throughout the 1990s • 1990 - ¥428,826 billion (USD 1 trillion) • 2000 - ¥469,480 billion (USD 4.66 trillion) • Unemployment • Rose from 2.1 % in 1991 to 4.7 % by year end 2000 • When comparing unemployment to other countries it may seem low, however, 4.7 % is unheard of in Japan • Decade earlier unemployment never passed 2.8 %
The Lost Decade • Time period where economic growth stopped • Lack of favorable results from fiscal & monetary policies (to be discussed next) • Japanese cultural habits of saving and frugality didn’t help the situation • Situation persisted until 2003
Liquidity Trap? • Between 1994 and 2000 the government tried to revive the economy through fiscal policy • 1994 - six spending programs totaling ¥ 66 trillion and cut income tax rates • 1998 Q1 – additional tax cuts, this time ¥ 2 trillion • Q2 - fiscal stimulus package worth more than ¥ 16.7 trillion • Q4 – yet another fiscal stimulus package worth ¥ 23.9 trillion • 1999 – the government trys throwing ¥ 18 trillion at the problem with recession recovery • Finally, October 2000, Japan announced yet another fiscal stimulus package of 11 trillion yen • Results: Total gov’t debt exceeds 100% of GDP
Next Batter • With deflation having gripped the Japanese economy in the early 1990s, in addition to the aforementioned fiscal policy, monetary options were exercised. • 2001 – Central Bank attempts to use its muscle and stop deflation by reducing interest rates • Interest rates are pushed down to near zero for a substantial period of time with no favorable results • 2009 Japan still has low interest rates and the Nikkei continues to drop
This Decade • After years of give-and-take GDP growth, 2003 appeared to be the turn around point • Junichiro Koizumi • Privatize government agencies • Cut wasteful programs • Control country’s budgets • Develop a plan to get Japan out from the mountain of debt • Results: • Japan saw consecutive growth for first time since 1997 • Ultimately situation still worsened but at a slower rate.
Recent Times • Hard won gains, wiped out • Rise in commodities hurt economy (07-08) • Global recession has slowed world-wide demand for goods • The Bank of Japan suffered a net loss of ¥12.1 billion since September, a departure from the ¥456.4 billion in gains made a year earlier, culprit to blame were foreign exchange losses caused by the yen's appreciation and a decline in dividends on shares purchased by the BOJ from major banks
Statement of Monetary Policy • Nov 20, 2009 release – Boring!!! • October 30, 2009 • overnight call rate to remain at around 0.1 % • temporary measures, such as purchase of CP and corporate bonds • temporary special funds-supplying operations to facilitate corporate financing • Expansion in the range of corporate debt and asset-backed commercial paper eligible as collateral • complementary deposit facility to provide ample funds sufficient to meet liquidity demand in financial markets.
Nikkei vs DJI (Jan 85 – Nov 09) Nikkei 225 Dow Jones Industrial
質問か。 Questions?