Download
1 / 8
80 likes | 188 Views
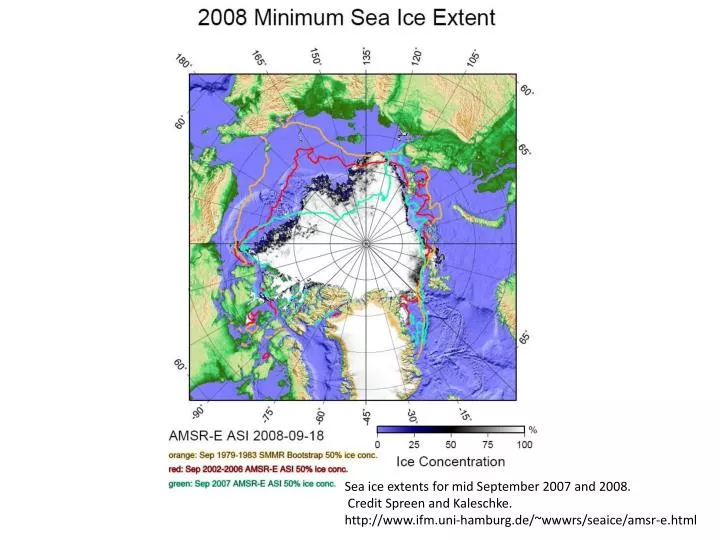
Sea ice extents for mid September 2007 and 2008. Credit Spreen and Kaleschke. http://www.ifm.uni-hamburg.de/~wwwrs/seaice/amsr-e.html. 6 million km2 3m thick 18 000 km3. 3 million km2 1.5m thick 4500 km3.

E N D
Sea ice extents for mid September 2007 and 2008. Credit Spreen and Kaleschke. http://www.ifm.uni-hamburg.de/~wwwrs/seaice/amsr-e.html
6 million km2 3m thick 18 000 km3 3 million km2 1.5m thick 4500 km3 Trend in loss of ArcticSeaIce volume calculatedfrom a seaice data assimilation model from Overland and Wang 2013 based on values from the PIOMAS projectat the UW (USA)
Tfreez - 1.7C WARMER
ice Volume km3 Year
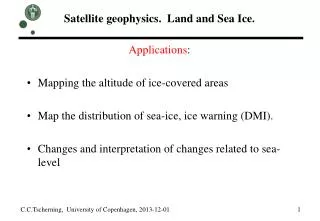
The Arctic Ocean polar stereo-projection showing the 70°N - 80°N and 80°N - 90°N band of latitudes and the line (bold black) stretched along the 90°W and 90°E meridians separating the Arctic Atlantic sector from the Arctic Pacific sector arbitrarily.
The Arctic sea-ice extent annual cycle within the 70°N - 80°N band of latitudes for the past 10 years.
The important factor is not only that the Arctic sea-ice extent minimumcharacterizing the Arctic sea-ice retreat each year in summer (around mid-September) is decreasing but it is also because the melting period was steadily increasing by few days every year during the past 10 years. both factors are very important for evaluating opportunities, risks and hazards for ship traffic along the NSR and NWP