Download
1 / 45
500 likes | 746 Views
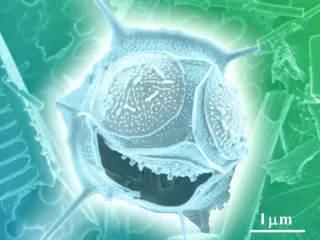
Phytoplankton 2. Community Dynamics. photosynthesis. Photosynthesis: relationship between light & temperature. 5C 15C 25C. Photoinhibition. Euglena with red masking pigment. Flotation mechanisms. Flotation Mechanisms.

E N D
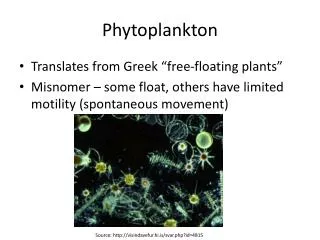
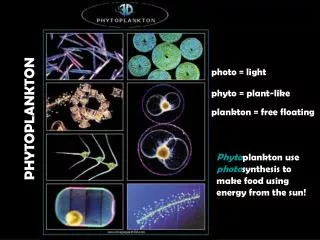
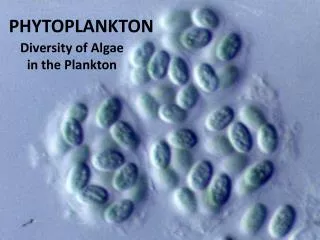
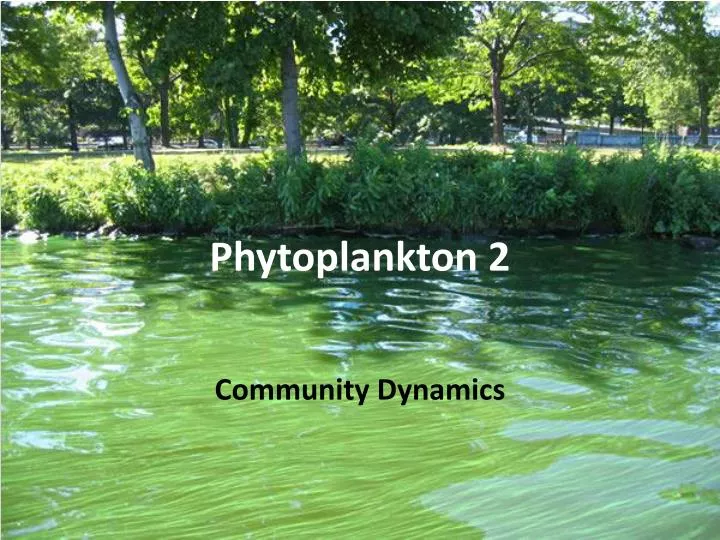
Phytoplankton 2 Community Dynamics
Photosynthesis: relationship between light & temperature 5C 15C 25C
Flotation Mechanisms • Increase surface:volume to increase frictional resistance. e.g. Ceratium
Flotation Mechanisms • Production of mucilage. e.g. Gloeocapsaand Staurastrum
Flotation Mechanisms • Gas vacuoles. e.g. Anabaena
Flotation Mechanisms • Accumulation of lipid. e.g. Botryococcus
Flotation Mechanisms • Change buoyancy by exchanging monovalent and divalent ions. Documented for dinoflagellates in marine environments, not in freshwater.
Flotation Mechanisms • Swimming by flagella. Ceratium Pandorina Euglena Cryptomonas
Competition relative to the concentration of a limiting nutrient Compare with Figure 15-4
Growth Rate • Examples of growth and competition • = Cosmarium= Staurastrum
Vitamin Requirements • Compare with Table 15-7
Winter Populations and Spring Maximum • Growth declines in winter when temperature is low and light is low (Figure 15-9). • Sometimes production under ice cover can be significant (Figure 15-10). • Sometimes spring maximum begins with growth under ice. • Usually spring maximum after turnover and dominated by a single species (Figure 15-11).
Seasonal succession of major groups of phytoplankton in Lake Erken, Sweden
Production and loss of Asterionella in Lake Windermere, England (28 April – 30 June)
Spring Decline and Summer • Decline in nutrients (especially Si) in the photic zone • In very productive lakes (high phosphate loading) Diatoms Greens Bluegreens
Fall Turnover and Autumn Circulation • Temperatures decline • Reduced grazing by zooplankton • High nutrient availability Dominated by large cells and filaments; usually dominated by diatoms
Limitation and Availability of Growth Factors in Reservoirs Consider differences between lakes and reservoirs
Parasitism and Grazing • Parasites: • Chytrids • Viruses • Grazers: • Heterotrophic Protists • Zooplankton (see Figure 15-13) • Cladocerans • Copepods • Rotifers
Competitive Interaction & Species Diversity • Diversity indices • Species diversity declines as fertility increases • In eutrophic waters, diversity increases in the summer and declines in the winter.
Vertical Distribution of Phytoplankton Biomass in Lakes and Reservoirs • Figure 15-14 Chlorophyll a in Lawrence Lake • Figure 15-15 Carotenoids in Lawrence Lake • Figure 15-16 Phaeophyton in Lawrence Lake
Rates of Primary Production by Phytoplankton Measured as mg carbon fixed per cubic meter per day Figure 15-22 for Lawrence Lake. Figure 15-24 for Wintergreen Lake
Efficiency of Light Utilization • Utilization of light between 350 and 700nm (Table 15-10) • In water column efficiency relatively low at surface (light above saturation) • Efficiency increases slightly with depth but overall carbon fixation decreases (Figure 15-27)
Efficiency increases slightly with depth but overall carbon fixation decreases
Extracellular Release of Organic Compounds • Loss of photosynthate • Many compounds are inhibitory (allelopathy)
Diurnal Changes in Phytoplankton • Relative to light saturation • Relative to synchronous division and metabolism • Vertical migration
Horizontal Variation • Related to morphometry of lakes and reservoirs (e.g. Figure 15-12) • Related to longitudinal zones within reservoirs and streams