Download

1 / 30
300 likes | 448 Views
Leveraging the Strengths of IT and Business for Rapid Tableau Adoption at Cisco. Cisco Systems. PRESENTED BY. Ben Torgesen & Sudharshan Seerapu. A Year Ago…. 2012 Tableau Customer Conference in San Diego

E N D
Leveraging the Strengths of IT and Business for Rapid Tableau Adoption at Cisco Cisco Systems PRESENTED BY Ben Torgesen & Sudharshan Seerapu
A Year Ago… 2012 Tableau Customer Conference in San Diego Tableau had been an enterprise tool for six months. Twenty groups were using the enterprise environment.
Enterprise Tableau Adoption • Business teams were purchasing their own BI software • Gaps identified in our BI strategy • Advanced Analytics & Visualizations • Rapid BI Prototyping • Self-Service BI • Business teams could no longer wait for large-scale IT engagements to deliver dashboards and analytics • They needed to play with the data • They needed to play with visualizations • They needed to be able to act on a hunch • They needed to be able to react to rapidly changing conditions
Combine the Best of Business and IT • Business • Know their Data • Asking the Right Questions • Collaborating with Other Groups • Get the Job Done • IT • Platforms • Technical Integrations • Governance
What the Business Does Best… • Business teams access enterprise data, departmental data, third-party data, custom data, and frequently are combining the different data elements. • Business teams ask the right questions. • Business gets the job done! • Business collaborates through the Tableau Center-of-Excellence.
Tableau Center-of-Excellence • While IT helps facilitate the COE, the business provides content for monthly meetings, discussion forums, training tools, and best practices.
What IT Does Best… • A centrally-managed enterprise Tableau server • Server administration • 24/7 monitoring, maintenance, upgrades, patches, and case resolution • Integration with other IT tools and processes (SSO, Kintana for lifecycle management, scheduling, backups, DR, OnRamp, etc…) • Vendor management • Performance tuning • Operational statistics • Training, support, and consulting (in conjunction with Tableau Center-of-Excellence) • Streamlined engagement and governance
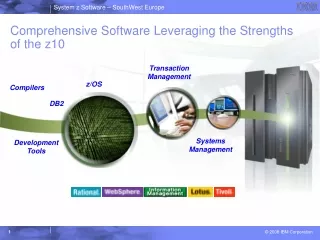
Enterprise Tableau Server Architecture Data Sources Tableau Server Production Tableau Server Stage Tableau Server Development
Enterprise Tableau Server Architecture Data Teradata Data Report Spec Tableau Desktop Oracle Essbase Worker2 Worker1 Worker4 Worker3 Background Enterprise Web App Web App Web App Web Server Report Consumer (Web based) Background VizQL VizQL VizQL Background Data Server Data Server Data Server Gateway SQL Server, MySQL, etc… Background Data Engine Repository Data Engine(2) Repository(2) Excel, Flat Files, other… Load Balancer HTML5 - Mobile Shared NAS (1 TB) Completed Report Departmental
Support, Maintenance, & Integration • Regularly scheduled and communicated upgrades • External 24/7 monitoring system integrated with Tableau (paging me day or night ) • Integration with external scheduling platform, Tidal, allows for event based extract refreshes and failure alerts • Single sign-on integration custom built using trusted tickets • Automated system backups • Future – Web-based UI for image generation • Future – Integration with OnRamp for automatic user creation
Engagement Process • “Two weeks and two meetings” • Engage with our team via email to our email alias • Initial 30 min. meeting to evaluate use case and technology choice • Fill out engagement questionnaire (14 questions) • Identify approver for functional area from governance team for review • Final 30 min. meeting with governance team to review data sources and possible overlap with other reporting applications • With approval, create site on Tableau servers • Update WebEx Social Tableau Server Engagement pages
Engagement - Demo WebEx Social – Enterprise Tableau information and management
Business and IT Governance • Unobtrusive Governance (Post vs. Pre) • No gatekeepers • Proactively reach out to groups when best practices are not met • Business Governance • Quarterly (and ad-hoc) review of groups and data sources • Visibility into dashboards and workbooks • Ongoing discussion for enhancing enterprise tools and migrating data to enterprise databases (where appropriate) • IT Governance • Monthly review of usage, performance, operational metrics, and other internal IT-focused areas • Make site administrators responsible • Supply usage/performance metrics
High ROI and Customer Satisfaction • “Operating at the pace of business” • “Best thing to come from IT in years” • “Have retired almost all spreadsheet reports” • “Replaces a lot of manual work” • “Once users saw the prototype dashboards the new requirements came in quickly” • CIO has asked for teams presenting Quarterly Ops Metrics to use Tableau (instead of PowerPoint) • Additional ROI Metrics <PENDING>
Explosive Growth • From 20 sites (business teams) a year ago, to over 100 today
Among those new use cases, big data analytics has taken off…
Big Data Visualization in Tableau Visualization Enterprise Data Warehouse • Capture, Store, Refine Big Data Audio/Video Images Text Web & Social Machine Logs CRM SCM ERP
Big Data Solution Framework Application Layer Tableau Hadoop Processing Engine Hive Tables Analytics Correlation Event Statistics Rules Org Hierarchy Data By Organization By Functional groups Filter User Data By Technology Endpoints By Individual Transform Data Ingress: ETL IP Audio Jabber IP Video WebEx Meetings TP & ACR email WxS Post
Data Maturity Life Cycle RAW DATA REFINED DATA INFORMATION
Collaboration Challenges Good Fair Better • Measuring Collaboration remains elusive • Little to no collaboration data • Lack of reference points for “good usage” • Unaware of what is actually getting used (and how) • Difficult to understand what internal customers want (or need) • Not using collaboration data to diagnose business problems • Difficult to be prescriptive about collaboration solutions for business outcomes Poor Best Collaboration Lack of measurement leads to under-investment
Insight to Relationships with the Lines of Business Outbound Asymmetry in collaboration styles with lines of business. Inbound Outbound Link to more data Email Inbound WebEx
WebEx Collaboration: Strategic Partnerships Across the BusinessBased on volume of WebEx traffic • Most functional areas spend 50%+ time collaborating internally • Highest levels of collaboration fromIT (your strategic partners): • Finance • HR • Highest levels of Collaboration into IT is from (view IT as a strategic partner): • Sales • Customer Advocacy • Finance
IT to IT Collaboration GloballyNumber of WebEx Meetings Hosted from the United States • Majority of IT communications are within the US • 2nd highest number of WebEx sessions outside the US is to India