Download

1 / 13
130 likes | 259 Views
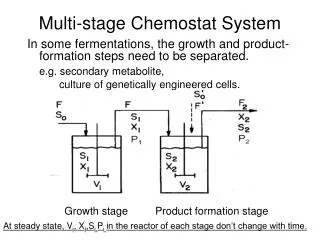
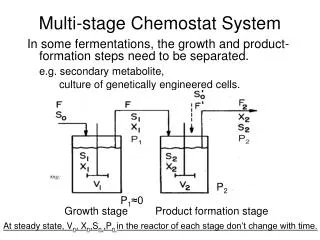
Chemostat Model. dx/dt = rate produced – rate out dS/dt = rate in – rate out – rate consumed.

E N D
dx/dt = rate produced – rate out dS/dt = rate in – rate out – rate consumed
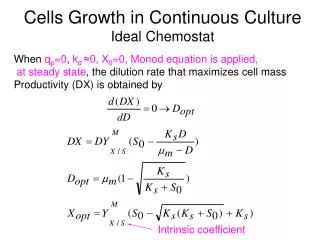
Assume g(S)=mS/(a+S), a Monod or Michaelis-Menton saturation function, which means that the organism is limited in its ability to consume nutrient. m is the maximal growth rate (units 1/t) and a is the half-saturation constant (units mass/vol). g(a)=m/2
Model Analysis When m>1andλ<1, the equilibrium (0,1) is a saddle and E=(1-λ,λ) is globally stable. If m=3 and a=1 then E=(.5,.5).
λ1=.5, λ2=.667 λ1=.5, λ2=.4 Competition x1, x2 on Σ λ1=.5, λ2=.5
Prey-Predator a1=0.3
References • L. Edelstein-Kesket, Mathematical Modelsin Biology, Random House, New York, 1988. • S.B. Hsu, S.P. Hubbell and P. Waltman, A mathematical theory for single nutrient competition in continuous cultures of micro-organisms, SIAM Jour. Appl. Math. 32, 366-383, 1977. • H.L. Smith and P. Waltman, The Theory of theChemostat: Dynamics of Microbial Competition, Cambridge University Press, 1995.