Download
1 / 1
10 likes | 219 Views
Supplemental Figure E. S catter of death rates with epidural and systemic analgesia. Published and unpublished data. 30%. Equality. 25%. Tikuisis 2004. 20%. Jidéus 2001. Death rate with epidural analgesia. 15%. 10%. 5%. 0%. Yeager 1987. 0%. 5%. 10%. 15%. 20%. 25%. 30%.

E N D
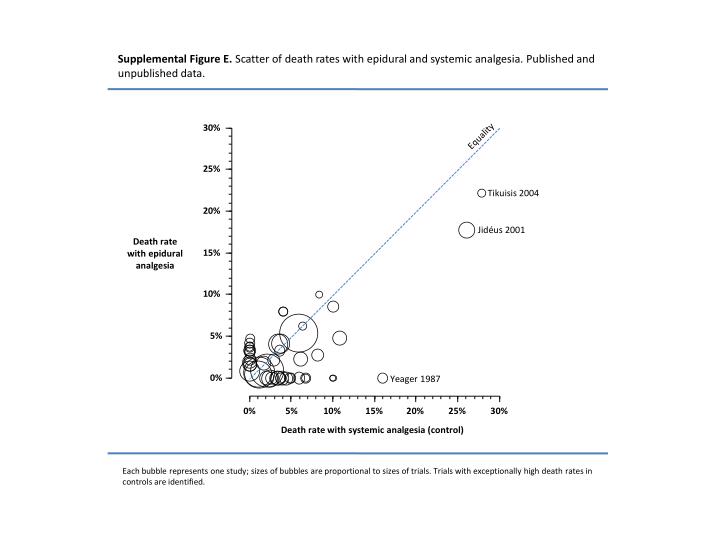
Supplemental Figure E. Scatter of death rates with epidural and systemic analgesia. Published and unpublished data. 30% Equality 25% Tikuisis 2004 20% Jidéus 2001 Death rate with epidural analgesia 15% 10% 5% 0% Yeager 1987 0% 5% 10% 15% 20% 25% 30% Death rate with systemic analgesia (control) Each bubble represents one study; sizes of bubbles are proportional to sizes of trials. Trials with exceptionally high death rates in controls are identified.