Download
1 / 25
250 likes | 445 Views
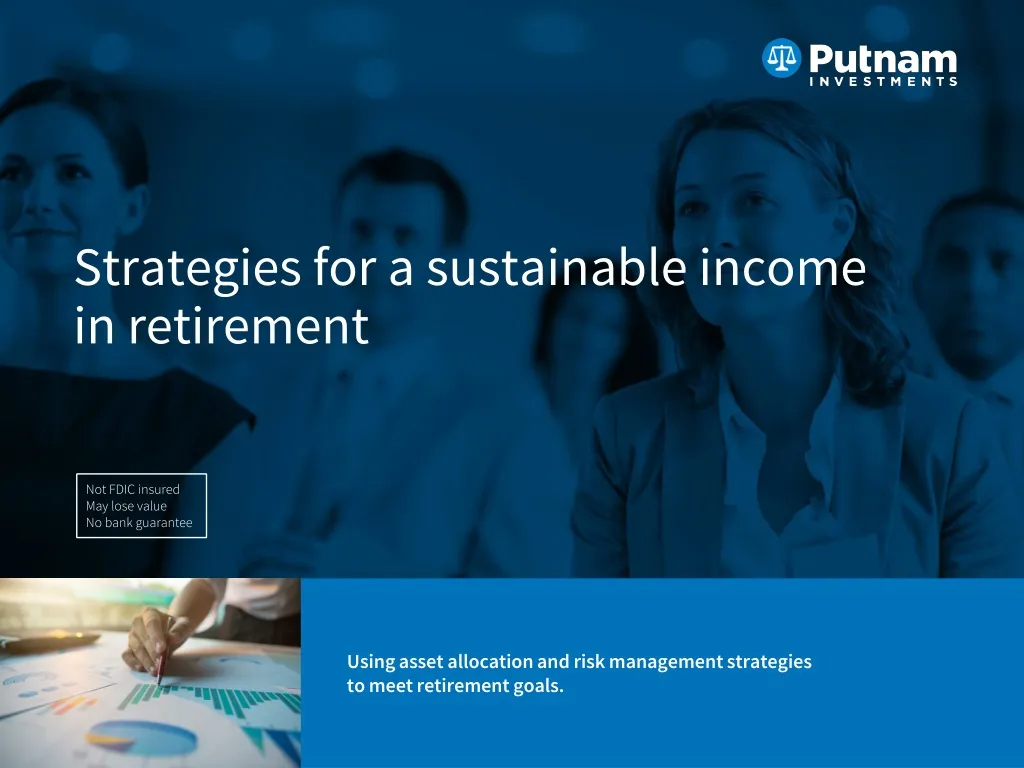
Strategies for a sustainable income in retirement. Using asset allocation and risk management strategies to meet retirement goals. Topics for today. Five key challenges to prepare for in retirement Achieving a successful retirement Putting an income plan into practice.

E N D
Strategies for a sustainable income in retirement Using asset allocation and risk management strategies to meet retirement goals.
Topics for today • Five key challenges to prepare for in retirement • Achieving a successful retirement • Putting an income plan into practice
Five challenges we can prepare for • Longevity • Inflation • Health-care costs • Public policy changes • Investment risks and volatility
Longevity: Plan on spending25 to 30 years in retirement Your lifespan probability after reaching age 65 100% will live to age 65 93% will live to age 70 82% will live to age 75 68% will live to age 80 49% will live to age 85 11% will live to age 95 28% will live to age 90 2% will live to age 100 Age Sources: National Center for Health Statistics, 2011; U.S. Life Tables, September 2015. Most recent data available.
Even low levels of inflation make a difference over time Amount needed to maintain purchasing power based on: • 30 years of saving • $50,000 income $287,174 $162,169 $90,568 Inflation rate
Health-care costs have outpaced earnings and inflation over the past 15 years ... • Source: Kaiser Family Foundation, September 2016.
What about Social Security? $0 $$ Source: Social Security Administration 2016 Annual Report.
Total debt remains high based on historical norms Federal debt held by the public (% of GP), 1940–2016 Percentage of GDP 2016 Source: Congressional Budget Office, Updated Budget Projections: August 2014; does not include intra-governmental debt.
Achieving a successful retirement • Diversify to manage volatility and achieve growth • Make sure you’re not withdrawing too much • Consider adding guaranteed income • Be smart about taxes • Address other potential risks
How long would your money have lasted? Choose the right withdrawal rate Allocation Cash 10% Bonds 30% 3%will last50 years Stocks 60% 4%will last33 years 5%will last20 years 6%will last16 years 7%will last13 years 8%will last12 years 9%will last11 years 10%will last10 years Percentage of your portfolio’s original balance withdrawn each year This example assumes a 90% probability rate. These hypothetical illustrations are based on rolling historical time period analysis and do not account for the effect of taxes, nor do they represent the performance of any Putnam fund or product, which will fluctuate. These illustrations use the historical rolling periods from 1926 to 2015 of stocks (as represented by an S&P 500 composite), bonds (as represented by a 20-year long-term government bond (50%) and a 20-year corporate bond (50%)), and cash (as represented by U.S. 30-day T-bills) to determine how long a portfolio would have lasted given various withdrawal rates. A one-year rolling average is used to calculate performance of the 20-year bonds. Past performance is not a guarantee of future results. The S&P 500 Index is an unmanaged index of common stock performance. You cannot invest directly in an index.
Address longevity risk Historical success of three asset mixes(assumes 5% withdrawal rate, adjusted for inflation annually) 80%–100% probability 60%–79% probability 0–59% probability The information at left shows how various asset allocations affect a portfolio’s expected longevity. It assumes that 5% of the original account balance is withdrawn each year and that withdrawals were increased each year to account for inflation. These illustrations are based on a rolling historical time period analysis and do not account for the effect of taxes, nor do they represent the performance of any Putnam fund or product, which will fluctuate. These illustrations use the historical returns from 1926 to 2014 of stocks (as represented by an S&P 500 composite), bonds (as represented by a 20-year long-term government bond (50%) and a 20-year corporate bond (50%)), and cash (U.S. 30-day T-bills) to determine how long a portfolio would have lasted given various withdrawal rates. A one-year rolling average is used to calculate performance of the 20-year bonds. Past performance is not a guarantee of future results. The S&P 500 Index is an unmanaged index of common stock performance. You cannot invest directly in an index.
Markets: When you retire can make a big difference Assumptions • $1 million nest egg • 5% withdrawn annually and increased each year to keep up with inflation • Invested in a portfolio of 60% stocks, 30% bonds, and 10% cash • Results over a 10-year time frame $1,861,592 $1,731,989 $1M $472,238 Retirein 1980 Retirein 1990 Retirein 2000 Sequence-of-returns risk refers to the adverse effect that negative investment returns in the early stages of retirement can have on a nest egg.
Consider diversifying more broadly in retirement U.S. large-cap stocks U.S. high-yield bonds U.S. Treasury bills Hedge funds Floating-ratebank loans Commodities Developed country international stocks Global investment-grade bonds Real estate investment trusts U.S. investment-grade bonds U.S. small-cap stocks Emerging-market stocks Inflation-protected securities U.S. growth and value stocks Emerging-market bonds Traditional asset classes are defined as those included in traditional balanced portfolios, such as stocks, bonds, and cash, and that have been widely owned by individual investors since the post-war emergence of modern portfolio theory. Modern asset classes are specialized investments that were created or have become more accessible since the advent of broader market participation by individual investors due to tax-advantaged retirement saving
Income: Importance of guaranteed sources Example • Balanced portfolio — 50% stocks, 40% bonds, 10% cash • 5% withdrawn annually • Guaranteed income based on current immediate annuity rates Probability of portfolio survival over 30 years This example is based on rolling historical time period analysis and does not account for the effect of taxes, nor does it represent the performance of any Putnam fund or product, which will fluctuate. Assumes historical rolling periods from 1926 to 2015 of stocks (as represented by an S&P 500 composite), bonds (as represented by a 20-year long-term government bond (50%) and a 20-year corporate bond (50%)), and cash (as represented by U.S. 30-day T-bills) to determine how long a portfolio would have lasted given a 5% withdrawal rate. A one-year rolling average is used to calculate performance of the 20-year bonds. Guaranteed income is based on a single premium, immediate annuity for a 65-year-old male assuming single life expectancy at current (August 2016) annuity rates. Past performance is not a guarantee of future results. The S&P 500 Index is an unmanaged index of common stock performance. You cannot invest directly in an index.
Pay attention to order This is not intended as tax advice. Please consult your independent tax advisor regarding tax ramifications. Dividend and capital gains rates reflect highest marginal tax rate (20%) plus the 3.8% net investment income surtax.
Use a Roth strategy to control your tax bill • Source of tax-free income in retirement • Access to tax-free source of income provides more options on where to draw income from • No mandatory withdrawals at age 70½ • Having a portion of retirement savings in a Roth IRA can provide a hedge against the threat of rising taxes in retirement
Preserve your wealth in retirement through tax efficient withdrawals
Putting an income plan into practice • Expenses Expense approach:Matching income sources with expenses Time-frame approach:Considering a bucket strategy • Income
Closing thoughts ✓ The retirement landscape will continue to evolve It’s critical for investors to prepare for certain (and uncertain!) risks A thoughtful income strategy can help you address these challenges and attain the lifestyle in retirement you desire Meet with your financial advisor to assess your personal situation ✓ ✓ ✓
Additional resources On the web • AARP, www.aarp.org • Social Security Administration, www.ssa.gov • American Savings Education Council, www.asec.org • ElderWeb, www.elderweb.com • Medicare, www.medicare.gov • National Association of Home Care Providers, www.nahc.org
Investors should carefully consider the investment objectives, risks, charges, and expenses of a fund before investing. For a prospectus, or a summary prospectus if available, containing this and other information for any Putnam fund or product, call your financial representative or call Putnam at 1-800-225-1581. Please read the prospectus carefully before investing.