Download
1 / 1
10 likes | 388 Views

E N D
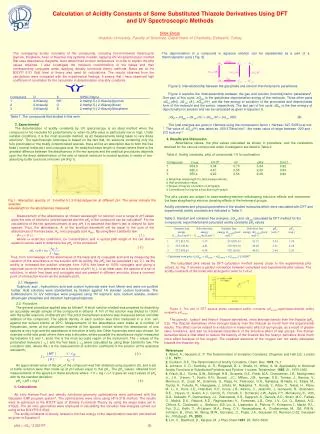
The overlapping acidity constants of the compounds, including five-membered heterocyclic (pyrrole, thiophene, furan or thiazole) ring systems in water, applying UV-Vis spectroscopic method that uses absorbance diagrams, were determined at room temperature. In order to explain the pKa values obtained, I also investigate the molecule conformations of the bases and their corresponding conjugate acids, applying density functional theory methods. Basis set at the B3LYP/ 6-31 G(d) level of theory was used for calculations. The results obtained from the calculations were compared with the experimental findings. It seems that I have observed high coefficient of correlation for the calculation in determination of acidity constants. The deprotonation of a compound in aqueous solution can be represented as a part of a thermodynamic cycle ( Fig. 3). Calculation of Acidity Constants of Some Substituted Thiazole Derivatives Using DFT and UV Spectroscopic MethodsDilek ElmalıAnadolu University, Faculty of Sciences, Department of Chemistry, Eskisehir, Turkey Figure 2. Interrelationship between the gas phase ans solution thermodynamic parameters Figure 2 explains the interrelationship between the gas and solution thermodynamic parameters5. One part of this cycle, DGgas is the gas-phase deprotonation energy of the molecule. Three other parts DGsol (AH),DG sol (A-), DGsol (H+)are the free energy of solvation of the protonated and deprotonated form of the molecule and the proton, respectively. The last part of the cycle DGR, is the free energry of deprotonation in solution and can be calculated as given in Equation 6. DGR = DGgas +DG sol (A-) + DGsol (H+)-DG sol (AH)(6) The total energies are given in Hartrees using the conversation factor 1 Hartree= 627.5095 kcal mol-1. The value of DGsol(H+) was taken as -259.375kcal mol-1, the mean value of range between -220 and -270 kcal mol-1. Compound R X IUPAC Name 1 2-thiazolyl NH 2-methyl-5-( 2-thiazolyl)pyrrole 2 2-thiazolyl O 2-methyl-5-( 2-thiazolyl)furan 3 2-thiazolyl S 2-methyl-5-( 2-thiazolyl)thiophene Table 1. The compounds that studied in this work. 2. Experimental The determination of acidity constants by UV spectroscopy is an ideal method when the compound is too insoluble for potentiometry or when its pKa value is particularly low or high. Under suitable conditions, it is the most accurate method, as all measurements being taken in very dilute solutions1. The spectroscopic technique is based on the fact that, for solutions containing only the fully protonated or the totally nonprotonated species, there will be an absorption due to both the free base ( neutral molecule ) and conjugate acid. An analytical wave length is chosen where there is the greatest diffrence between the absorbances of the two species and the analtical procedures depends upon the the direct determination of the ratio of neutral molecule to ionized species in series of non-absorbing buffer solutions of known pH (Fig 1). 4. Results and Discussion Absorbance values, the pKa values calculated as shown in procedure, and the corelations obtained for the various compounds under investigation are listed in Table 2. Table 2.Acidity constants, pKa, of compounds 1-6 for protonation. Compound la/nmH1/2b mcpKa Corr.d 1 354,0 3,34 0,73 3,34 0,92 2 360,3 4,67 0,55 2,43 0,94 3 355,4 4,22 0,54 2,28 0,92 a Analytical wavelength for pKa measurements, b Half-protonation value, c Slopes of logI as a function of pH graph, d Correlations for logI as a function of pH graph. The pKa values are subject to base-weaking-electron-withdrawing inductive effects and mesomeric the base stregthening-electron donating effects of the heteroaryl groups. Fig.1. Absorption spectra of 2-methyl-5-( 2-thiazolyl)pyrrole at different pH. The arrow indicate the selected wavelength for the absorbances measured. Acidity constants and physical parameters of the studied molecules which were calculated with DFT and experimental acidity constants are indicated in Table 3. Table 3. Standart and solvation free energies, DGsol and DGgas calculated by DFT method for the compounds. experimental and calculated acidity constants pKa values Measurement of the absorbance at chosen wavelength for solution over a range of pH values gives the ratio of neutral to ionized species and the pKaof the compound can be calculated2. For the calculations of the two species present at any pH, it is assumed that Beer’s law is obeyed for both species. Thus, the absorbance, A, at the analtical wavelenth will be equal to the sum of the absorbances of the free base, AB, and conjugate acid ABH+. By using Beer Lambert’s law: A= e x C x l ( 1 ) where e= extinction coefficient, C= concentration, and l= optical path length of the cell. Below equation can be used to determine the pKaof the compound. ( 2 ) Thus, from a knowledge of the absorbance of the base and its conjugate acid and by measuring the variation of the absorbance of the solution with its acidity, the pKacan be calculated ( eq. 2 ). As the acidity is increased the solution changes from 100% free base to 100% conjugate acid giving a sigmoidal curve for the absorbance as a function of pH ( Ho ). In an ideal case, the spectra of a set of solutions, in which free base and conjugate acid are present in different amounts, show a common point of intersection known as the isobestic point. a Calculated from pKa = [DGgas + DGsol(A-) – DGsol(AH) + DGsol(H+) ]/ 2.303RT The calculated pKa values by DFT calculation method seems closer to the experimental pKa values, so Fig. 3 showes a perfect correlation between calculated and experimental pKa values. The acidity constants of the molecules arranged in order to 1>3>2. 2.1. Reagents Sulphuric acid , hydrochloric acid and sodium hydroxide were from Merck and were not purified further. Acid solutions were standartized by titration against 1N standart sodium hydroxide. The buffersolutions for UV technique were prepared using 1N sulphuric acid, sodium acetate, sodium dihydrogen phosphate and disodium hydrogenphosphate. 2.2. Procedure. The general procedure applied was as follows3: A stock solution studied was prepared by dissolving an accurately weigth sample of the compound in ethanol. A 1ml of this solution was diluted to 100ml. with the buffer solutions of different pH. The pH of the buffered solutions was measured before and after addition of the compound. The optical density of each solution was then measured in a 1cm. cell, against the solvent blanks at 25oC. Measurements of the absorbance were made at a number of frequencies, some at the absorption maxima of the species involve where the absorbance of one species is very high and the absorbance of the other is fairly low. Other frquencies were also chosen, for example onthe side peak where there was a shoulder, where possible the absorbance region measured lay between 0.2 and 1, since this is the most accurate region of the instrument. The e values of the protonated molecule ( ep ) and the free base ( efb )were calculated by using Beer Lambert’s law. The ionization ratio, where the eis the measurement of extinction coefficient of the solution at the analytical wavelenth; Figure 3. The plot of DFT aqueus phase calculated acidity constants, pKa(calc.),againstexperimental acidity constants, pKa(expt.). The pyrrolyl-, furanyl- and thienyl- thiazole derivatives, show stronger basicty than the thiazole (pKa: 2.5). The thiazole derivatives show stronger basicty than the thiazole as found from the experimental results. This effect can be related to a reduction in mesomeric effect of aryl groups, as a result of greater steric hindrance, and also by increased importance of the inductive effect of aryl groups. The thienyl- derivative show a little effect to reduce the basicity of the thiazole but the furanyl- derivative show much more effect because of the oxygen. The unpaired electrons of the oxygen can not easily delocalize towards the thiazole ring. References 1. Albert, A.; Serjeant, E. P. The Determination of Ionisation Constants; Chapman and Hall Ltd.: London U.K., 1971. 2. Cookson, R.F., The Determination of Acidity Constants. Chem. Rev. 1974, 74,1. 3. Johnson, C. D.; Katritzky, A. R.; Ridgewell, B. J.; Shakir, N.; White, A. M. Applicability of Hammett Acidity Functions to Substituted Pyridines and Pyridine 1-oxides. Tetrahedron, 1965, 21, 1055-1065. 4. Frisch, M.J., Trucks, G.W., Schlegel, H.B., Scuseria, G.E., Robb, M.A., Cheeseman, J.R., Montgomery Jr., J.A., Vreven, T., Kudin, K.N., Burant, .J.C., Millam, J.M., Iyengar, S.S., Tomasi, J., Barone, V., Mennucci, B., Cossi, M., Scalmani, G., Rega, N., Petersson, G.A., Nakatsuji, M.Hada, H., Ehara, M., Toyota, K., Fukuda, R., Hasegawa, J., Ishida, M., Nakajima, T., Honda, Y., Kitao, O., Nakai, H., Klene, M., Li, X., Knox, J.E., Hratchian, H.P., Cross, J.B., Adamo, C., Jaramillo, J., Gomperts, R., Stratmann, R.E.,. Yazyev, O., Austin, A.J., Cammi, R., Pomelli, C., Ochterski, J.W., Ayala, P.Y., Morokuma, K., Voth, G.A., Salvador, P., Dannenberg, J.J., Zakrzewski, V.G., Dapprich, S., Daniels, A.D., Strain, M.C., Farkas, O., Malick, D.K., Rabuck, A.D., Raghavachar,i K., Foresman, J.B., Ortiz, J.V., Cui, Q., Baboul, A.G., Clifford, S., Cioslowski, J.,. Stefanov, B.B, Liu, G., Liashenko, A., Piskorz, P., Komaromi, I., Martin, R.L., Fox, D.J., Keith, T., Al-Laham, M.A., Peng, C.Y., Nanayakkara, A., Challacombe, M., Gill, P.M.W., Johnson, B., Chen, W., Wong, M.W., Gonzalez, C., Pople, J.A., Gaussian 03, Revision C.02, Gaussian Inc., Pittsburgh, PA, 2003. 5. Lim, C., Bashford, D., Karplus, M. J.Phys.Chem1991. 95, 5610-5620. ( 3 ) An approximate value of the pKaof the compound was first obtained using equation (3), and a set of buffer solution were then made up at pH values equal to this pKa. The pKavalues, obtained from measurements of the spectra in these solutions where -1.0 < log I <+1.0 gave an exact values of pKa with its the standart deviation. pKa= pH + log I ( 4 ) 3. Calculations Ab initio Hartree-Fock and density functional geometry optimizations were performed with the Gaussian 03W program system4. The optimizations were done using HF/3-21G method. The results were re-optimized at the B3LYP type of Density Functional Theory by using the larger basis set 6-31G(d). The ab initio geometries were employed in calculating the solvation free energies carried out using at the B3LYP/6-31G(d). The acidity constants is directly related to the free energy of the deprotonation reaction and defined as given in Equation 5 pKa = DGR / 2.303 RT(5)