Download
1 / 19
190 likes | 265 Views
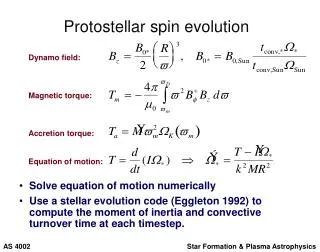
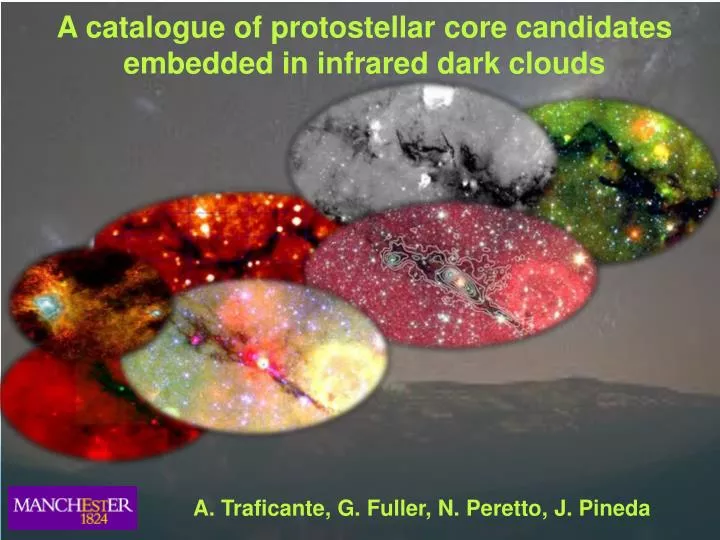
A catalogue of protostellar core candidates embedded in infrared dark clouds. A. Traficante , G. Fuller, N. Peretto , J. Pineda. IRDCs. Dense, cold objects seen in absorption against the strong mid-IR background. Perault et al. 1996. First catalogue produced using MSX data

E N D
A catalogue of protostellar core candidates embedded in infrared dark clouds A. Traficante, G. Fuller, N. Peretto, J. Pineda
IRDCs Dense, cold objects seen in absorption against the strong mid-IR background Perault et al. 1996 First catalogue produced using MSX data High-resolution catalogue with Spitzer data (GLIMPSE – MIPSGAL surveys) Simon et al .2006 Peretto & Fuller 2009 SDC16.965-0.95 8μm 24μm • Coverage: l ≤ |65°| b ≤ |1°| • Spatial resolution: 2” GLIMPSE 8 μm • 6” MIPSGAL 24 μm • Selected regions: column density ≥ 1022 cm-2 24μm SDC15.221-0.427 8μm ≈ 15000 IRDCs in the inner Galactic Plane with different shapes and size up to several arcmin A. Traficante EWASS 2012
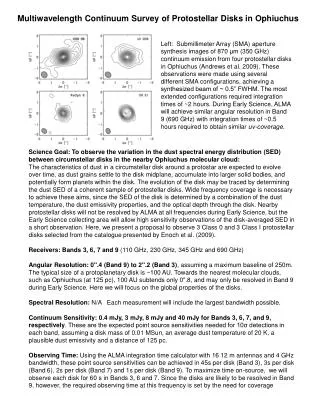
IRDCs: how do they look like in the FIR? IRDCs are likely the best site of the prestellar and protostellar cores The emission of pre- and proto- stellar cores peaks in the Far-IR Observing the FIR emission of the sources embedded in the IRDCs allows us to build their SEDs and to constraint the relevant physical parameters (temperature, mass, luminosity…) Motte et al. 2010 Evaluating SEDs for a large sample of these objects allows us to produce a statistical analysis of the properties of these stellar nursery site! A. Traficante EWASS 2012
Galactic Plane in the FIR: Hi-GAL survey Herschel Hi-GAL • PACS and SPIRE in parallel mode (60”/s) • 5 wavelengths (70, 160, 250, 350, 500 μm) • The whole Galactic Plane. The first Hi-GAL covers |l|≤ 67, |b| ≤ 1° • Series of 2° x 2° tiles l = 30° SDP field 500μm 70 μm 160 μm 350μm 250μm Hi-GAL survey - Molinari et al. 2010 ROMAGAL pipeline - Traficante et al. 2011 A. Traficante EWASS 2012
Pre- and proto- stellar candidates catalogue 1 Infrared Dark Clouds (IRDCs) selection Source extraction from Hi-GAL data Source analysis Work in progress: some source statistics 2 3 4 A. Traficante EWASS 2012
1 IRDCs selection ≈ 15000 IRDCs from Peretto & Fuller 2009 catalogue IRDCs selected in the longitude range 15° ≤ l ≤ 55° ≈ 3800 Subsample of IRDCs for which the distance is known (13CO peak from GRS associated with the IRDCs) ≈ 3650 A. Traficante EWASS 2012
2 Source extraction 70 μm • Looking for pre- and proto- stellar candidates in IRDCs • Selection of IRDCs in Hi-GAL images • Sources observed in emission in the Hi-GAL wavelengths • Analysis restricted to the sources observed at • 70μm, 160μm, 250μm 160 μm 8 μm 250 μm SDC16.965-0.095 Source extraction and photometry in 3 “easy” steps: A. Traficante EWASS 2012
2 Source extraction Step 1:source identification at 70 μm: high-pass filtered image used to isolate source peaks SDC16.965-0.095 70μm SDC16.965-0.095 high-pass filtered A. Traficante EWASS 2012
2 Source extraction Step 1: source identification at 70 μm: high-pass filtered image used to isolate source peaks SDC16.965-0.095 70μm SDC16.965-0.095 high-pass filtered A. Traficante EWASS 2012
2 Source extraction Step 1: source identification at 70 μm: high-pass filtered image used to isolate source peaks Step 2: 2d gaussian fit SDC16.965-0.095 70μm SDC16.965-0.095 high-pass filtered A. Traficante EWASS 2012
2 Source extraction Step 1: source identification at 70 μm: high-pass filtered image used to isolate source peaks Step 2: 2d gaussian fit Step 3: aperture photometry at each wavelength using longest wavelength fit. Selection of source observed at all wavelengths (70, 160, 250 μm) SDC16.965-0.095 70μm SDC16.965-0.095 160μm SDC16.965-0.095 250μm A. Traficante EWASS 2012
2 Source extraction Step 1: source identification at 70 μm: high-pass filtered image used to isolate source peaks Step 2: 2d gaussian fit Step 3: aperture photometry at each wavelength using longest wavelength fit. Selection of source observed at all wavelengths (70, 160, 250 μm) 5 5 5 3 3 3 1 1 1 SDC16.965-0.095 70μm SDC16.965-0.095 160μm SDC16.965-0.095 250μm total sources at 70 μm: 6 total sources at 70 μm, 160 μm and 250 μm: 3 We know the source distance: 3.38 kpc A. Traficante EWASS 2012
3 Source analysis SEDs fitting: e.g. Preibisch et al. 1993, Elia et al. 2010 Free parameters: temperature T, mass M From the fit: luminosity L A. Traficante EWASS 2012
3 Source analysis SEDs fitting: e.g. Preibisch et al. 1993, Elia et al. 2010 Free parameters: temperature T, mass M From the fit: luminosity L Source 5 275.43826 -14.162280 Source 3 275.51196 -14.175125 Source 1 275.48547 -14.222914 A. Traficante EWASS 2012
3 Source analysis Source 5 Source 3 Source 1 5 3 Bright diffuse MIPS 24 μm counterpart 1 1 70 μm 24 μm This will be done for all the sources in the selected IRDCs A. Traficante EWASS 2012
4 Source catalogue: work in progress For each source observed at 70μm, 160 μm and 250 μm the catalogue will contain: 2d-gaussian fit parameters SEDs and dust temperature Mass and luminosity For each IRDC the catalogue will contain: Hi-GAL 70μm, 160 μm, 250 μm IRDC image 2. List of sources observed at each different wavelength Catalogue status so far: 2187 over 3650 IRDCs Analyzed IRDCs in the range 15° ≤ l ≤ 30° ≈ 60 % of the IRDCs sources already extracted and analyzed A. Traficante EWASS 2012
4 Source catalogue: work in progress 29% of the 70 μm sources have 160 μm AND 250 μm counterpart Source observed at 70 μm : 7477 Source observed at 70, 160, 250 μm: 2234 Source dust temperature longitude distributions Temperature range: 10 ≤ T ≤ 40 K T = 25.4 K 17 sources (≈0.8%) with T ≥ 40 K 22 sources (≈1%) with T ≤ 15 K − A. Traficante EWASS 2012
4 Source catalogue: work in progress Mass distributions Luminosity distributions − M = 44.5 M ≈ 1500 ( 74% ) with M ≤ 100 M ≈ 140 ( 7% ) with M ≥ 300 M − L = 517 L ≈ 53 ( 2.5% ) with L ≥ 1e3 L Potentially high-mass star forming regions. Good targets for further investigations A. Traficante EWASS 2012
Next steps and conclusions • Complete the catalogue of FIR sources observed in all the 3650 IRDCs for which the distances are known • Longitude coverage: 15° ≤ l ≤ 55° • Evaluate the dust properties of all the sources observed at 70μm, 160 μm and 250 μm • Look at the MIPS 24 μm and IRAC 8 μm counterparts • Selection of good candidates for future follow ups • The catalogue will be publicly available and it will extend the already-published Spitzer IRDCs catalogue available at • http://www.irdarkclouds.org (Peretto & Fuller 2009) A. Traficante EWASS 2012