Download
1 / 21
210 likes | 329 Views
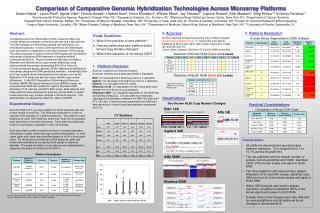
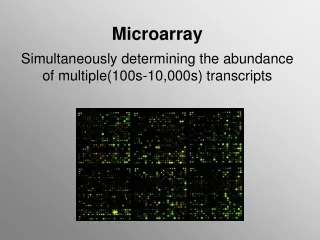
Finding Consistent Subnetworks across Microarray dataset. Fan Qi GS5002 Journal Club. Outline. Introduction Methodology Results & Discussions Conclusions. Introduction. Identify Differential Gene Expression Identify significant genes w.r.t a phenotype Importance:

E N D
Finding Consistent Subnetworks across Microarray dataset Fan Qi GS5002 Journal Club
Outline • Introduction • Methodology • Results & Discussions • Conclusions
Introduction • Identify Differential Gene Expression • Identify significant genes w.r.t a phenotype • Importance: • Testing effectiveness of treatment • Biological insights of diseases • Develop new treatment • Disease Prophylaxis • Any others ?
Current Methods • Individual Genes • Search for individual differentially expressed genes • Fold-change, t-test, SAM • Gene Pathway Detection • Looking at a set of genes instead of individual genes • Bayesian learning and Boolean network learning • Gene Classes • Adding existing biological insights • Over-representation analysis (ORA), Functional Class Scoring(FCS), GSEA, NEA, ErmineJ
Challenge • Different Results from Different Dataset of the SAME disease! • Zhang M [1] demonstrated inconsistency in SAM: Inconsistency among datasets Reconstruct from Table 1 in [1]
New Approach • SNet [2] • Proposed in 2011 • Utilize gene-gene relationship in analysis • Gene-gene relationship • Activates VS. Inhibits • Gene Subnetwork • Gene is the Vertex, Relationship is an edge From Fig 1 in [2] RHOA VAV PIK3R2 RAC1 IQGAP1 ARHGEF1 Partially adapted from Fig 2 in [2]
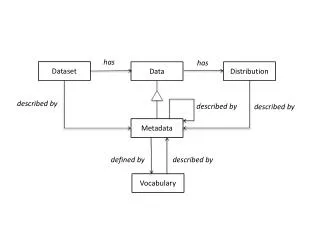
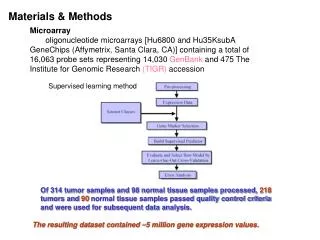
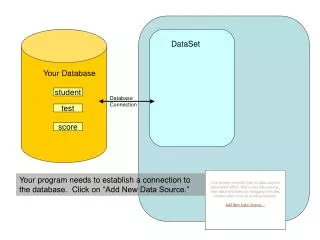
Methodology • Input: • Genes labeled with phenotype • Gain from microarray experiment • Third-party Info: • Gene Pathway Info • Gene Reaction Info • Attributes of Subnetwork • Size, Score • Output: • A set of significant sub-network Subnetwork Scoring Subnetwork Significance Subnetwork Extraction
Methodology –Step 1 Phenotypes Patient’s Gene Ranked List ……..
Methodology –Step 1 for patient Only top genes is kept Repeat for every phenotype group
Methodology –Step 1 ……. select genes occur in of patients Select one phenotype as others as
Methodology –Step 1 A list of Subnetworks w.r.t ……… Partition into multiple pathways Generate Subnetwork
Methodology – Step 2 • For each Subnetwork in in the and Patient , compute overall expression level: • = , where • a gene in that is highly expressed in • # patients in who have highly expressed • : total # patients in • For Patients and compute t-test T test Assign to each Subnetwork
Methodology – Step 3 • Randomly Swap Phenotype labels of patient, recreating subnetworks and t-test scores (step 1-2) • Repeat [A] for 1,000 permutations. • Forms a 2-D histogram () • Estimate the nominal p-value of each Subnetwork • Select Subnetwork with - Null-hypo: subnetwork with is not significant Fig 5 in original paper
Results and Discussions • Dataset: • Leukemia: Golub VS Armstrong • ALL: Ross VS Yeoh • DMD: Haslett VS Pescatori • Lung: Bhattacharjee VS Garber • Performance Comparison: • Subnetwork Overlap (with GSEA) • Gene Overlap (GSEA, SAM, t-Test) • Other Comparisons: • Network Size, Gene Validity with t-Test
Results and Discussions • Subnetwork Overlap Synthesized from Table 1, 2 from [2] Higher the better
Results and Discussions • Gene Overlap Synthesized from Table 3, 4,5 from [2] Higher the better
Results and Discussions • Size of subnetworks Reconstructed from Table 6 from [2]
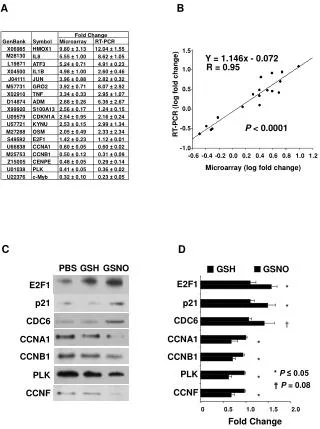
Results and Discussions • Validity • Compare the genes in EACH Subnetwork with those in t-test • Genes in each Subnetwork appears in T-Test is around 70%- 100% • Selected Results (too large to present full) Selected from Table 7,8,9,10 in[2]
Conclusions • Traditional Methods have inconsistency problem across different dataset of the same disease • SNet utilize Biological insights to mitigate the gap • Gene-to-Gene relationship • Gene Pathway knowledge • SNet shows better results than established algorithms • More consistent
References • [1] Zhang M, Zhang L, Zou J, Yao C, Xiao H, Liu Q, Wang J, Wang D, Wang C, GuoZ: Evaluating reproducibility of differential expression discoveries in microarray studies by considering correlated molecular changes. • [2]Donny Soh, Difeng Dong1, YikeGuo, LimsoonWong Finding consistent disease subnetworks across microarray datasets