Download
1 / 20
200 likes | 347 Views
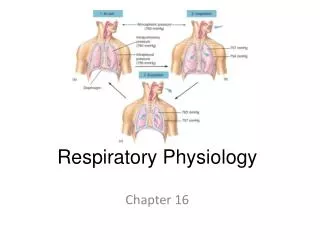
1 December 2009 Respiratory Physiology. Lab this week: A case study and measuring lung volumes and capacities with Powerlab. Bring calculator and textbook to lab. About the Final Exam….. Choice of Tuesday, Wednesday or Friday. Pulmonary arterial blood = low in O 2.

E N D
1 December 2009Respiratory Physiology Lab this week: A case study and measuring lung volumes and capacities with Powerlab. Bring calculator and textbook to lab. About the Final Exam….. Choice of Tuesday, Wednesday or Friday
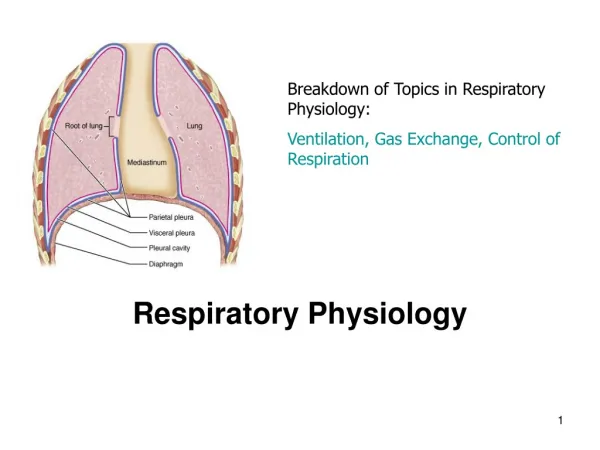
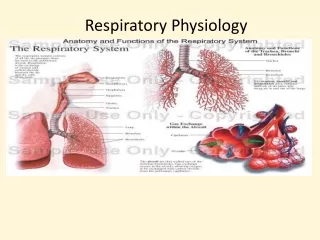
Pulmonary arterial blood = low in O2 Cartilage prevents collapse of airways during expiration.
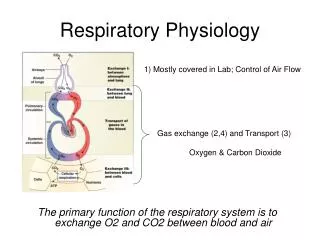
Type I pneumocytes are simple squamous epithelia that comprise the majority of the surface area. Type II pneumocytes secrete surfactant. Gas exchange by diffusion based on gradients.
Figure 13.17 Who cares? Respiratory Distress Syndrome of the Newborn Law of LaPlace Surfactant reduces surface tension which reduces the mechanical effort of ventilation and prevents the collapse of smaller alveoli.
Figure 13.19 Tidal inspiration At end of normal tidal expiration
V = VT x f VA = (VT – VDS) x f Anatomic dead space = air remaining in conducting zone (typically 150 ml.) What is VA if Tidal Volume is 150 ml?
CO2 production O2 uptake
CO2 production = Respiratory Quotient O2 uptake = 0.8 for proteins = 0.7 for fat = 1.0 for carbohydrates =0.8 for mixed diet 200 mlCO2/min 250 ml O2/min
Alveolar to arterial gradient is due toventilation/perfusion inequality. Ventilation by Bulk Flow Pulmonary Venous blood is equivalent to Systemic Arterial blood. Gas exchange Gas exchange Gradient for CO2 is only 6 mmHg; CO2 is more soluble and permeable than O2
Matching blood flow (Q, also called “perfusion” ) to ventilation (V) by pulmonary arterioles that constrict in response to low O2anddilate in response to hi O2 (Note this response to O2 is opposite that of systemic arterioles!) Thus, poorly ventilated regions of the lung will receive less blood flow. So…. Q is “matched” to V, but not perfectly. And low perfusion in a region leads to bronchoconstriction.
Figure 13.27 CO2 andO2 bound to Hb do not contribute to partial pressure (no longer a dissolved gas!)
Figure 13.31 Hb can bind O2, CO2, and H+ Increases in CO2 and H+ decrease the affinity of Hb for O2
Steep Flat
Shifting the Oxyhemoglobin dissociation curve At 40 Torr, more DPG, higher temperature, and greater acidity (all indicative of increased metabolism) shift dissociation curve down (Hb has a lower affinity for O2) and thus more O2 is unloaded into the tissues. Notice the main affect is on the steep portion of the curve which means that there is little influence on the loading of O2 onto Hb in the lungs
carbaminohemoglobin Chloride Shift CA = carbonic anhydrase Hb is a Buffer Carbon dioxide transport