Download
1 / 13
130 likes | 595 Views
Uprima ® Presentation TAP Holdings Inc. Barbara Bopp, Ph.D. Manager, Drug Metabolism and Pharmacology. Pharmacokinetics and Metabolism. Apomorphine Molecule. Pharmacokinetics & Metabolism. Not Morphine Not DEA scheduled. OH. HO. • HCl • 1/2 H 2 O. N. H. CH 3. Sublingual Tablet.

E N D
Uprima® PresentationTAP Holdings Inc. Barbara Bopp, Ph.D.Manager, Drug Metabolism and Pharmacology
Apomorphine Molecule Pharmacokinetics & Metabolism • Not Morphine • Not DEA scheduled OH HO • HCl • 1/2 H2O N H CH3
Sublingual Tablet Pharmacokinetics & Metabolism • Rapid absorption • Avoid first pass metabolism • Minimize food effect
2.0 2 mg 4 mg 5 mg 6 mg 1.5 Apomorphine Concentration (ng/mL) 1.0 0.5 0 8 7 0 1 2 3 4 5 6 Hours after Dose Phase IM98-844 Plasma Concentration–Time Curves Pharmacokinetics & Metabolism
M98-844 Apomorphine Pharmacokinetics Pharmacokinetics & Metabolism Mean (% CV) Parameter 2 mg SL 4 mg SL 5 mg SL 6 mg SL 1 mg SC tmax (h) 0.74 (40%) 0.72 (44%) 0.68 (31%) 0.66 (49%) 0.34 (51%) Cmax (ng/mL) 0.70 (54%) 1.25 (64%) 1.70 (78%) 1.91 (64%) 3.22 (52%) AUC (ng•h/mL) 1.23 (39%) 2.37 (45%) 2.92 (51%) 3.60 (48%) 3.39 (32%) t1/2 (h) 2.0 2.8 3.1 3.1 2.7
Phase I Dose Proportionality: Cmax and AUC¥ Pharmacokinetics & Metabolism M98-844 4 3 Cmax(ng/mL) or AUC (ng•h/mL) 2 1 Cmax AUC 0 0 1 2 3 4 5 6 Apomorphine HCI Dose (mg)
Distribution of Cmax Values from Uprima® (6 mg) Pharmacokinetics & Metabolism n (N = 246) ln Cmax-2.5 -2.0 -1.5 -1.0 -0.5 0.0 0.5 1.0 1.5 1.77 Cmax0.08 0.135 0.233 0.368 0.606 1.0 1.65 2.72 4.48 5.88 Apomorphine Cmax (ng/mL)
Apomorphine Plasma Concentrations in Elderly Pharmacokinetics & Metabolism M98-843 (Uprima® 5 mg)
Apomorphine Disposition Pharmacokinetics & Metabolism • Large volume of distribution • 85-90% protein bound, primarily to albumin • Minimal renal excretion of parent drug • Rapid clearance by hepatic metabolism
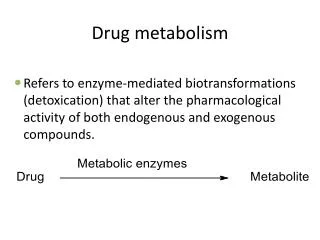
Major Metabolic Pathways for Apomorphine Pharmacokinetics & Metabolism O-Glucuronide and N-Glucuronide Glucuronidation OH O-Sulfate HO Sulfation and N N-Sulfate H CH3 N-Demethylation Sulfation Glucuronidation O-Sulfate Norapomorphine O- and/or N-Glucuronide
Apomorphine and Cytochrome P450 Pharmacokinetics & Metabolism • Norapomorphine formation accounts for about 20% of the dose and is mediated by cytochrome P450 (CYP) • Metabolized by several CYP isoforms, primarily CYP1A2, CYP3A, CYP2C19 • Inhibits CYP1A2, CYP3A, CYP2D6, but only at concentrations >1000-fold higher than Cmax • Low potential for CYP metabolic interactions
Apomorphine Pharmacokinetics: Conclusions • Rapid absorption and clearance • Effect of variability in apomorphine pharmacokinetics was appropriately assessed through the safety and efficacy data from Phase III studies • No dosage adjustment is necessary for the elderly • Primarily metabolized by conjugation with glucuronic acid or sulfate • Low potential for clinically significant CYP interactions