Download
1 / 43
430 likes | 458 Views
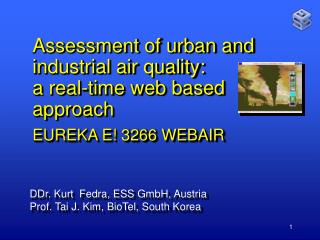
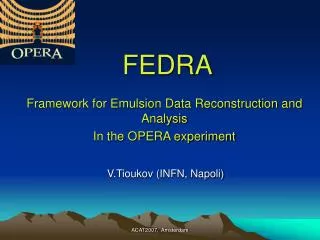
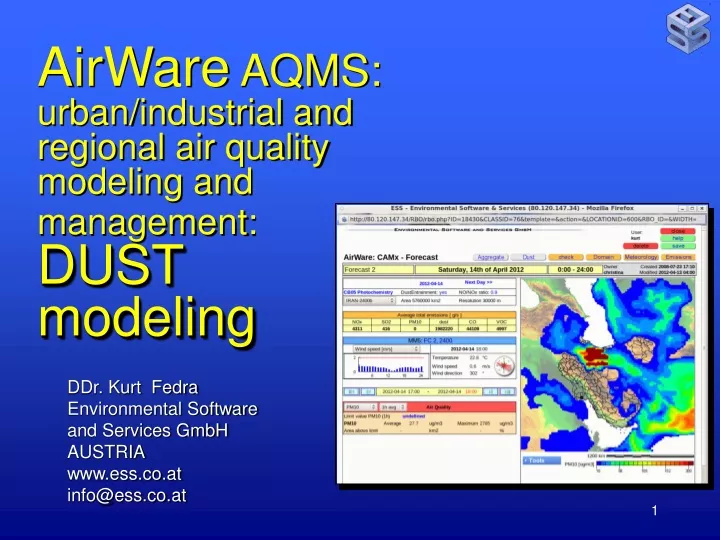
AirWare AQMS: urban/industrial and regional air quality modeling and management: DUST modeling. DDr. Kurt Fedra Environmental Software and Services GmbH AUSTRIA www.ess.co.at info@ess.co.at. Basic AQMS functions:.

E N D
AirWare AQMS: urban/industrial and regional air quality modeling and management:DUST modeling DDr. Kurt Fedra Environmental Software and Services GmbH AUSTRIA www.ess.co.at info@ess.co.at
Basic AQMS functions: • Data management (GIS, emissions, monitoring, scenarios, permits, ….) • Emission inventories: traffic, industry, households, land cover, soils (wind entrainment), biogenic sources (VOC) • Emission modelling (PEMS, natural dust: PM10,2.5, traffic - road, rail, shipping, air) • Transport and dispersion modeling, (photo)chemistry, wet and dry deposition • Impact assessment
Basic functions: Air quality modelling: • Main pollutants: SO2 (acid rain), NOx, CO, O3, PM10/2.5, benzene, lead, air toxics, POP, … • Forecasting, public information • Monitoring compliance • Impact assessment, scenario analysis Emission control (optimization, cost efficient solutions: BATNEEC)
Auxiliary tools: • Energy efficiency optimization, GHG emission control (Kyoto) • Technological risk assessment and management, accidental release • Noise modelling, mapping • Urban development (land use dynamics) • Water resources/supply, urban flooding • ISO 14000 environmental management • Technical training (eLearning)
Policy orientation: Web Based implementation: distributed remote access, possibility for cooperative use: • Continuous Analysis and Decision Support • Continuous record and data analysis/display • Shared information basis • Regulatory requirements: monitor and demonstrate compliance, reporting • Cooperation between institutions, “stakeholders” • Public information (web server) • Direct integration of economic criteria (economic efficiency, net benefit, CBA)
AirWare AQMS For more information, please visit the AirWare related web pages and on-line demos (login with default: guest) • http://www.ess.co.at/AIRWARE • http://www.ess.co.at/WEBAIR several “live” case studies on-line: • Henan(China), Gulf, Turkey, Cyprus, Malta, Croatia, Tehran/Iran, …
Implementation: • Fully web based implementation (cooperative data management) • Flexible client-server architecture, from stand-alone systems to distributed networks and shared clusters; • Clients: PC with standard • web browser, mobile clients • Ease of use: integration of simulation models, data bases (emission modeling), and monitoring (data assimilation)
Geographic domain: From large-scale (continental) to local street canyon nested models, nested grid
Modelling natural DUST PM10/2.5: Modelling of “natural” sources of “DUST” in nested domains with a new dynamic wind erosion and “entrainment” model, using wind speed (Weibull), vegetation/land cover, soils, soil moisture, relief Simulate long-range transport in this domain with a standard transport model (CAMx) to estimate local versus external inputs to the observed PM10 levels.
Geographical scope: Cyprus Nested model domains: • 4,800 km • 270 km • 3 - 60 km nested “city” domains The basic entrainment model works on a 1 km resolution, independent of domain.
Dust model inputs: • Vegetation index (derived from CVF data, land cover/land use) = “bare soil” • Soil type (FAO soil map of the world) • “Relief Energie” measures the variability of elevation within the 1 km2 cells based on 30 m DEM • Soil moisture (hourly results from a meteorological model, MM5 or WRF) • Wind field (hourly averages from the meteo forecast or re-analysis model, Weibull function)
Erodibility: vegetation Land cover from different RS/satellite or local map sources: NDVI, VCF, USGS, FAO, ….. composite data re-sampled at a 1 km resolution
Dynamic wind field (3 km prognostic, diagnostic interpolation to 1km) two-parameter Weibull function
Emission model The DUST emission model is a • non-linear ( a * windspeed ** b) • dynamic (hourly) • threshold model (minimal wind speed for the different soil classes) • that estimates emission (g/km2/s) as a function of: • the wind speed (Weibull function in 0.5 m/s steps up to N times the average wind speed MM5 (as cutoff)
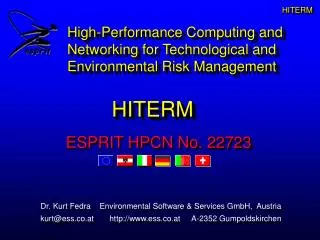
Post-processing: long range transport modeling Using MM5/CAMx model system (from EUREKA E!3266 WEBAIR) to simulate the transport of the dynamic dust emissions: • PM10 emissions from inventories and models (pyrogenic sources) • DUST entrainment for natural sources → transport, dispersion, deposition
Long range transport modeling Daily 120 hours (revolving) forecast MM5/CAMx nested grid simulation
Long range transport modeling CYPRUS: “Sahara Dust” one day event: May 5, 2011 observed: 235-245 μg/m3 simulated: 129/243 μg/m3
Monitoring vs modelling: Monitoring: • Daily gravimetric samples, 3 stations, chemicaland mineralogicalanalysis Modelling: • Hourlyconcentration values at the monitoringsites
Post-processing: emission control optimization • assign PM10 control technologies to individual or classes of sources; • select a baseline (episode) • generate large sets of alternative solutions • identify non-dominated (pareto optimal subset) • select a “preferred solution” = control strategy • test/evaluate the effects of emission reductions with the transport model