Download
1 / 31
310 likes | 321 Views
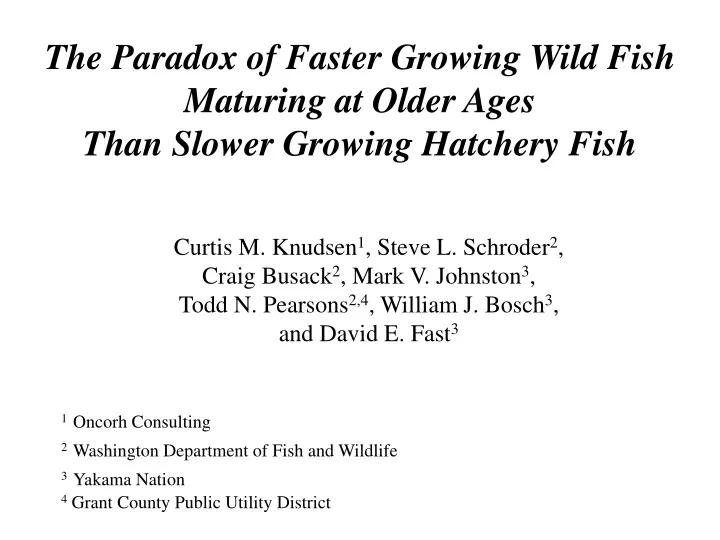
The Paradox of Faster Growing Wild Fish Maturing at Older Ages Than Slower Growing Hatchery Fish. Curtis M. Knudsen 1 , Steve L. Schroder 2 , Craig Busack 2 , Mark V. Johnston 3 , Todd N. Pearsons 2,4 , William J. Bosch 3 , and David E. Fast 3 1 Oncorh Consulting

E N D
The Paradox of Faster Growing Wild Fish Maturing at Older Ages Than Slower Growing Hatchery Fish Curtis M. Knudsen1, Steve L. Schroder2, Craig Busack2, Mark V. Johnston3, Todd N. Pearsons2,4, William J. Bosch3, and David E. Fast3 1Oncorh Consulting 2Washington Department of Fish and Wildlife 3Yakama Nation 4 Grant County Public Utility District
Objectives: • Describe two predictions made from Life History Theory • Results from the High and Low Feed Ration study and compare them with the Life History Theory predictions • Describe the Growth/Maturation Paradox • Results from 2007 and 2008 for NO, SH and HC populations • What processes are in here play that result in empirical results that are contradictory to the predictions one would make from LHT? • Examples of other correlated life history or fitness related traits
Two basic predictions made from Life History Theory: • When a population experiences increased growth in body size then fish should 1. mature at younger ages and 2. at larger size-at-age.
Fast growth Slow growth % Jacks Body size Life History Predictions
High and Low Feed Ration study results, then compare them with the Life History Theory predictions
20 15 10 Mean Body wt (g) LO 02 HI 02 LO 03 5 HI 03 LO 04 HI 04 0 Apr May Jun Jul Aug Sep Oct Nov Dec Jan Feb Mar Juvenile body weight over time up to volitional release BY02-04 High ration Low ration Each female’s eggs were divided in half and split between the two treatment groups controlling for any genotype differences
Age 3 Age 4 Mean difference over years and acclimations sites 0.3 cm Treatment effect p=0.023 CF 42 ES 59.5 JC 59.0 41 POHP length (cm) POHP length (cm) 58.5 Mean difference over years and acclimations sites 1.0 cm Treatment effect p=0.027 40 58.0 39 57.5 High Ration Low Ration High Ration Low Ration 100% High Low 80% Mean Age Composition (BY02-04) 60% Mean % age 40% 20% 0% 3 4 5 Age HR 25%> LR
Fast growth Slow growth High Ration Observed Low Ration % Jacks Body size Life History Predictions
The Growth/Maturation Paradox: Hatchery origin fish return at a smaller size-at-maturity, but mature at younger mean age
Age 4 High R 0.3 cm > Low R High Ration 25% greater Age 4 NO 1.5 cm > SH Hatchery mean 45% greater % Jacks Body size High feed ration Low feed ration Wild Hatchery
Genotype 1 Genotype 2 Genotype 3 Norms of reaction 6 4 Phenotypic trait value 2 0 Environment 1 Environment 2
SH HC NO Age 4 size-at-age reaction norms for NO, SH and HC fish 62 4.5 Body wt. (kg) POHP length (cm) 60 4.0 58 3.5 2007 2008 2007 2008 Brood year Brood year Origin effect p=0.001 Tukey MCT HC < SH < NO
SH HC NO Age 3 size-at-age reaction norms for SH, HC and NO fish In 2008 fish were 25-58% larger than 2007. Significant GxE interaction p<0.05. 48 2.00 46 1.75 44 Body weight (kg) POHP length 1.50 42 1.25 40 2007 2008 2007 2008 Brood year Brood year 2007 Origin effect p<0.001, Tukey MCT HC < SH < NO 2008 Origin effect p>0.5
NO SH HC Percentage Age 3 by Broodyear 35% 25% Percent Age 3 15% 5% 1997 1999 2001 2003 Mean (+ 1 sd) Broodyear
% Jacks Body size Fast growth Life History Predictions Slow growth Wild Observed Hatchery Our results significantly disagree with LHT predictions. The reason is have three different genotypes: NO, SH and HC.
What possible processes are in play here that produce results that are contrary to the predictions from LHT?
NO Wild trait distribution H Hatchery fitness function Relative fitness Evolutionary trajectory Body size θ Wild fitness function Relative fitness Body size
HC SH NO Reaction norms follow this trend: HC (2 Gen)< SH (1 Gen)< Natural Origin H Hatchery fitness function Relative fitness Body size Evolutionary trajectory
HC maturation threshold SH maturation threshold • Given a smaller size-at-age maturation threshold, then: • smaller age specific size-at-maturity and • younger age composition. Body size NO Maturation threshold Time
Body size % Jacks High growth Low growth Wild Hatchery Life History Predictions Observed
What about other life history or fitness related traits correlated with body size?
9.0 HC SH 8.5 loge(Fecundity) 8.0 7.5 3.8 3.9 4.0 4.1 4.2 4.3 loge(POHP) 2008 Results: HC ♀’shave 8.2% > fecundity than SH females ANCOVA equal means p=0.061
-1.3 -1.5 loge(Eggwt) -1.7 -1.9 1.0 1.5 2.0 loge(Body weight) 2008 Results: SH eggs are 9% larger than HC eggs ANCOVA equality of means p=0.037 SH HC
6.1 6.0 5.9 5.8 ln(Body wt) 5.7 Origin 5.6 HC SH 5.5 SN 5.4 3.50 3.55 3.60 3.65 ln(Fork length) Fry Body Size at ponding BY08 ANCOVA equal slopes p<0.001
2008 HC,2007 HC,2008 NO,2007 2007 NO,2008 -1.0 Each year NO testes were 9.4% heavier than HC testes ANCOVA Origin effect p=0.057 -1.5 NO Loge(Testes wt) HC -2.0 -2.5 5.8 6.0 6.2 6.4 loge(POHP length)
1.30 HC 1.25 SH 1.20 AS(Survival) 1.15 NO 1.10 2007 2008 Year Mean Eyed-Egg Survival (+ 1 SE) ANOVA Origin effects p=0.080
Summary • LHT predictions are correct when dealing within a single population or genotype • NO, SH and HC populations have different reaction norms because they are different genotypes as a result of domestication effects • Other traits correlated with body size are also showing the effects of domestication • Evidence of selection for a hatchery type and against NO type within the hatchery
Hatchery 0.50 Wild Proportion age 3 0.25 0.00 Mean 1997 1999 2001 2003 1997-2004 (+ 1 sd) Brood year
6.1 6.0 5.9 5.8 Ln(Body wt) 5.7 Origin HC 5.6 SH 5.5 SN 5.4 3.50 3.55 3.60 3.65 Ln(Fork length) Source Sum - of - Squares df Mean - Square F - ratio P LN_FL 1.7950 1 1.7950 307.9954 < 0.0001 ORIGIN 0.1394 1 0.1394 23.9207 < 0.0001 ORIGIN*LN_FL 0.1403 1 0.1403 24.0713 < 0.0001 Error 1.9057 327 0.0058 Fry Body Size at ponding BY08 ANCOVA equal Slopes p<0.001