Download
1 / 20
200 likes | 344 Views
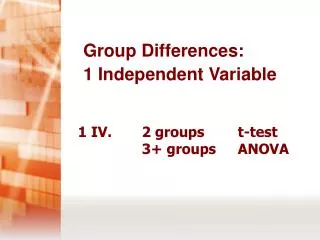
The t-Test for Differences Between Groups. The t-Test. Tests whether the means of two groups are statistically different from each other. Statistical Analysis. Statistical Analysis. Control group mean. Statistical Analysis. Control group mean. Treatment group mean.

E N D
The t-Test Tests whether the means of two groups are statisticallydifferent from each other
Statistical Analysis Control group mean
Statistical Analysis Control group mean Treatment group mean
Statistical Analysis Control group mean Treatment group mean Is there a difference?
What Does Difference Mean? Medium variability
What Does Difference Mean? Medium variability High variability
What Does Difference Mean? Medium variability High variability Low variability
What Does Difference Mean? The mean difference is the same for all three cases. Medium variability High variability Low variability
What Does Difference Mean? Medium variability High variability Which one shows the greatest difference? Low variability
What Does Difference Mean? • A statistical difference is a function of the difference between meansrelative to the variability. • A small difference between means with large variability could be due to chance. • Like a signal-to-noise ratio. Which one shows the greatest difference? Low variability
What Do We Estimate? Low variability
What Do We Estimate? Signal Noise Low variability
What Do We Estimate? Signal Difference between group means = Noise Low variability
What Do We Estimate? Signal Difference between group means = Noise Variability of groups Low variability
What Do We Estimate? Signal Difference between group means = Noise Variability of groups _ _ XT - XC _ _ = SE(XT - XC) Low variability
What Do We Estimate? Signal Difference between group means = Noise Variability of groups _ _ XT - XC _ _ = SE(XT - XC) = t-value Low variability
What Do We Estimate? • The t-test, one-way Analysis of Variance (ANOVA) and a form of regression all test the same thing and can be considered equivalent alternative analyses. • The regression model is emphasized here because it is the most general. Low variability