Download
1 / 28
280 likes | 423 Views
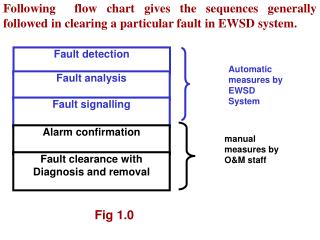
Statistical Fault Detection and Analysis with AutomaDeD. Greg Bronevetsky in collaboration with Ignacio Laguna, Saurabh Bagchi , Bronis R. de Supinski , Dong H. Ahn , and Martin Schulz. Reliability is a Critical Challenge in Large Systems. Need tools to detect faults, identify causes

E N D
Statistical Fault Detection and Analysis with AutomaDeD Greg Bronevetskyin collaboration withIgnacio Laguna, SaurabhBagchi, Bronis R. de Supinski, Dong H. Ahn, and Martin Schulz
Reliability is a Critical Challenge in Large Systems • Need tools to detect faults, identify causes • Fault tolerance : requires fault detection • System management: need to know what failed • Faults come from various causes • Hardware: soft errors, marginal circuits, physical degradation, design bugs • Software: coding bugs, misconfigurations
In General Fault Detection and Fault Tolerance is Undecidable • Option 1: Make all applications fault resilient • Application-specific solutions hard to design • Many applications • How does fault resilience compose? • Option 2: Develop approximate fault detection, tolerate via checkpointing et al • Statistically model application behavior • Look for deviations from model behavior • Identify model components that likely caused deviation
In General Fault Detection and Fault Tolerance is Undecidable • Option 2: Develop approximate fault detection, tolerate via checkpointing et al • Statistically model application behavior • Look for deviations from model behavior • Identify model components that likely caused deviation Application Model
Focus on Modeling Individual MPI Applications • Primary goal is fault detection for HPC applications • Model behavior of single MPI application • Detect deviations from norm • Identify origin of deviation in time/space • Other branches of field • Model system component interactions • Model application as dataflow graph of modules • Model micro-architecture state as vulnerable/non-vulnerable (ACE analysis)
Goal: Detect Unusual Application Behavior, Identify Cause MPI Application . . . . . . . . . Single Run - SpatialDifferences between behavior of processes Multiple RunsDifferences between behavior of runs Single Run - TemporalDifferences between one time point and others
Semi-Markov Models • SMM - Transition system • Nodes: application states • Edges: transitions from one state to another • Probability of transition • Time spent in prior state before transition B .2 / 5μs .7 / 15μs A C .1 / 500μs D
SMMs Represent Application Control Flow • SMM states correspond to • Calls to MPI • Code Between MPI Calls Semi-Markov Model Application Code main()Init main() { MPI_Init() … Computation … MPI_Send(…, 1, MPI_INTEGER, …); for(…) foo(); MPI_Recv(…, 1, MPI_INTEGER, …); MPI_Finalize(); } foo() { MPI_Send(…, 1024, MPI_DOUBLE, …); …Computation… MPI_Recv(…, 1024, MPI_DOUBLE, …); …Computation… } Computation main()Send-INT main()foo()Send-DBL Different statefor different calling context Computation main()foo()Recv-DBL Computation main()Recv-INT main()Finalize
Transitions Represent Time Spent at States • During execution each transition observed multiple times Time series of transition times: [t1, t2, …, tn] • Represented as probability distribution • Gaussian • Histogram .2 / 5μs .7 / 15μs .1 / 500μs
Transitions Represent Time Spent at States • Gaussian • Histogram DataSamples Time Values • Cheaper • Lower Accuracy Probabilities Time Values • More Expensive • Greater Accuracy Line Connectors Histogram Bucket Counts Gaussian Tail Time Values
Using SMMs to Help Detect Faults • Hardware faults → behavior abnormalities • Given sample runs, learn time distribution on each transition (Top and bottom 0% or 10% of each transition’s times removed) • If some transition takes an unusual amount of time, declare it an error Probabilities Time Values
Detection threshold computed from maximum normal variation • Need threshold to separate normal, abnormal timing • Threshold = lowest probability observed in set of sample runs (Top and bottom 1% removed) Probabilities Time Values
Evaluated Fault Detector Using Fault Injection • NAS Parallel Benchmarks • 16-process runs • Input class A • Used BT, CG, FT, MG,LU and SP (EP and IS use MPI in very simple ways) • Local delays (FIN_LOOP): 1, 5, 10 sec • MPI message drop (DROP_MESG) or repetition (REP_MESG) • Extra CPU-intensive (CPU_THR) or Memory-intensive (MEM_THR) thread
Rates of Fault Detection Within 1ms of Injection NoDetection False DetectionBefore Injection Detection of FaultWithin 1ms DetectionAfter 1ms Filtering Usually ImprovesDetection Rates Single-Point EventsEasier to Detect ThanPersistent Changes
SMMs used to Help Identify Software Faults in MPI Applications • User knows application has fault but needs help to focus on cause • Help identify point where fault first manifests as change in application behavior • Key tasks on faulty run: • Identify time period of manifestation • Identify task where fault first manifested • Identify code region where fault first manifested
Focus on the Time Period of Unusual Behavior • User marks phase boundaries in code • Compute SMM for each task/phase Task 1 Task 1 Task 1 Task 1 Task 2 Task 2 Task 2 Task 2 Task 1 Task 2 . . . . . . . . . . . . Task n Task n Task n Task n Task n
Focus on the Time Period of Abnormal Behavior • Find phase with most unusual SMMs • If sample runs available, compare faulty run’s SMMs to sample runs’ SMMs • If none available, compare each phase to others Faulty Run Sample Run . . .
Cluster Tasks According to Behavior to Identify Abnormal Task • User provides application’s natural cluster count k • Use sample execution to compute clustering threshold τ that produces k clusters • Use sample runs if available • Otherwise, compute τ from start of execution • During real runs cluster tasks using threshold τ Task n Task 1 Task 2 . . . Master-Worker Bug in Task 9 Task 6 Task 7 Task 8 Task 2 Task 1 Task 2 Task 3 Task 3 Task 7 Task 5 Task 6 Task 4 Task 8 Task 9 Task 1 Task 5 Task 4 Task 9
Cluster Tasks According to Behavior to Identify Abnormal Task • Compare tasks in each cluster to their behavior in • Sample runs • Start of execution • Most abnormal is identified • Transition most responsible for difference identified as origin Bug in Task 9 Task 3 Task 4 Task 5 Task 6 Task 7 Task 8 Task 9 Task 1 Task 2
Evaluated Fault Detector Using Fault Injection • NAS Parallel Benchmarks • 16-task, Class A: BT, CG, FT, MG,LU and SP • 2000 injection experiments per application • Local livelock/deadlock (FIN_LOOP, INF_LOOP) • Message drop (DROP_MESG), repetition (REP_MESG) • CPU-intensive (CPU_THR) or Memory-intensive (MEM_THR) thread • Examined variants of training runs • 20 training runs with no faults • 20 training runs, 10% have fault • No training runs
Phase Detection Accuracy • Accuracy ~90% for Loops and Message drops, ~60% for Extra threads • Training significantly better than no training (10% bug training is close) • Histograms better than Gaussians Training vsNo Training NoFault Sample vs Some Faults Gaussian vs Histogram
Cluster Isolation Accuracy • Results assume phase detected accurately • Accuracy of Cluster Isolation highly variable • Depends on propagation of fault’s effects • Accuracy upto 90% for extra threads • Poor detectionelsewhere sinceno informationon event timing
Cluster Isolation Accuracy • Extended cluster isolation with information on event order • Focuses on first abnormal transition • Significantly better accuracy for loop faults
Transition Isolation • Accuracy: injected transition in top 5 candidates • Accuracy ~90% for Loop faults • Highly variable for others • Less variable if event order information is used
Abnormality Detection Helps Illuminate MVAPICH Bug • Job execution script failed clean up at job end, left runaway processes on nodes • Simulated by executing BT (16- and 64-task runs)concurrently with LU, MG or SP (16-task runs) • Experiments show • Average SMM difference in regular BT runs • Difference between BT runs with interference and no-interference runs • Overlap execution during initial portion of BT run
Abnormality Detection Helps Illuminate MVAPICH Bug • Experiments show • Average SMM difference in regular BT runs • Difference between BT runs with interference and no-interference runs
Abnormality Detection Helps Illuminate MVAPICH Bug • Experiments show • Average SMM difference in regular BT runs • Difference between BT runs with interference and no-interference runs
Behavior Modeling is Critical Component of Fault Detection and Analysis • Complex behavior of applications and systems • Statistical models provide accurate summary • Promising results • Quick detection of faults • Focused localization of root causes • Ongoing work • Scaling implementations to real HPC systems • Improving accuracy through • More data • Models custom-tailored to applications