Download

1 / 18
190 likes | 365 Views
BOVINE TUBERCULOSIS TESTING IN MICHIGAN. MS&E 220:Probabilistic Analysis (Group Project). David Blum Ioannis Giannakakis Abra Jeffers Ahren Lacy. Background.

E N D
BOVINE TUBERCULOSIS TESTING IN MICHIGAN MS&E 220:Probabilistic Analysis (Group Project) David Blum Ioannis Giannakakis Abra Jeffers Ahren Lacy
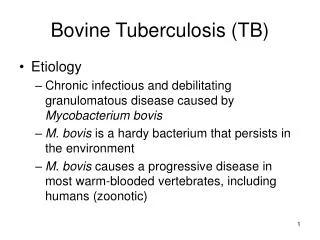
Background • Tuberculosis is a widespread, potentially fatal disease. The bovine form of Tb, M. bovis, has a wide range of hosts including humans. • A series of tests is performed by the state on a percentage of all Michigan herds per year, including: • Caudal Fold Test (CFT), • Comparative Cervical Test (CCT), and • Gamma interferon.
Model formulation A decision tree is constructed which includes • all the successive tests, • the probabilities of being infected given the results of the tests, • the decisions taken about whether or not to continue testing, and • the total cost in each of the different cases. We treated each herd as existing in one of two following states: • high frequency of Tb infection, • low frequency of Tb infection Tb transmission within herds with high frequency of Tb infection is sufficiently high that it is less costly to cull the herd than to eradicate Tb though ongoing testing and slaughtering of individual cattle
Model formulation • Before administering a test, one has a prior belief as to whether the herd has a low infection rate or a high infection rate • We flip the tree, to determine one’s posterior belief that the herd is highly infected given that there are k positive readings from the current test. • Assumption: Each cow tests independently of each other cow in the herd. • The probability of seeing k positives (given that the herd is highly or low infected) can be modeled as a binomial distribution.
Assessing Posterior Belief of Infection For any single test Probability of seeing k positive results follows a binomial dist
Assessing Posterior Belief of Infection The probability a cow tests positive on a test (given it has tested positive previously) where
Baseline Parameters • H = Herd with high frequency of infection • L = Herd with low frequency of infection • I = the cow being tested is actually infected with Tb • P(I|H) =2.49% • P(I|L) =0.01% • P(H) =0.22%
Baseline Parameters TestSensitivitySpecificity CFT 85% 95% CCT 75% 98% Gamma 85% 93%
Analysis • Plot P(H|K) versus k at every model. • The curve is S-shaped. • As the number of positive observations within a herd increases, the herd infection belief increases more steeply • A “sharp” S curve implies a good test, • Strong distinction in posterior beliefs
Findings • Increasing the accuracy of any given test “sharpens” the corresponding S-curve and shifts left, • Thus fewer positive observations are required to convince an observer that the herd is highly infected. • Improving the accuracy of the first test (CF) is the most efficient way to improve the information available to an observer. • The information conveyed through subsequent tests is less sensitive to a change in test accuracy than each preceding test.
Findings • P(I|H) is an important factor affecting the shape of the P(H|k) curve. • P(I|L) has little to no effect on the shape of the posterior P(H|k) curve consistent with assumptions • The prior belief P(H) does not affect the shape of the P(H|k) curve, though it does shift the curve horizontally • Thus test results greatly outweigh the prior within a range of likely priors (0.001% to 5%)
References • Jeffers, K. J. (2008). Personal Communication. October 15, 2008. • O’Reilly, L. M. and C.M. Daborn. (1995). The Epidemiology of Mycobacterium bovis Infections in Animals and Man: A Review. Tubercule and Lung Disease. 76(S.1): 1 – 46. • VanderKlok, M. S. (2008). Bovine Tuberculosis in Michigan: Where We Are Today. Bovine TB Scientific Meeting, East Lansing, MI [online]. Available: http://www.michigan.gov/documents/emergingdiseases/MDA_Update_Part_2_249465_7.pdf [Accessed October 20, 2008]. • Judge, L. J (2005). Epidemiologic update for the Michigan bovine TB program, [online]. Available: http://www.michigan.gov/documents/MDA_2005_BTB_Report2_148142_7.pdf • Radintz, T, and DiConstanzo, A (2008). Impancts of Bovine Tb Testing and Associated Costs on Cow-Calf Producer Profitability in 2008-2009. University of Minnesota Extension.