Download
1 / 60
600 likes | 619 Views
Progress Monitoring in Reading: How to Use the Data. A module for pre-service and in-service professional development MN RTI Center Authors: Lisa Habedank Stewart, PhD & Adam Christ, graduate student Minnesota State University Moorhead www.scred.k12.mn.us click on RTI Center.

E N D
Progress Monitoring in Reading:How to Use the Data A module for pre-service and in-service professional development MN RTI Center Authors: Lisa Habedank Stewart, PhD & Adam Christ, graduate student Minnesota State University Moorhead www.scred.k12.mn.us click on RTI Center
MN RTI Center Training Modules This module was developed with funding from the MN legislature It is part of a series of modules available from the MN RTI Center for use in preservice and inservice training: 2
Overview This module is Part 2 of 2 Part 1: Why, What, How to Progress Monitor Part 2: Using Progress Monitoring Data
Why Progress Monitor? When teachers USE progress monitoring Students learn more! Teachers design better instructional programs Teacher decision making improves Students become more aware of their performance Safer & Fleishman, 2005
Graphing/Displaying the Data “A picture is worth a thousand words”
Making a Graph Show changes in instruction with “lines” and labels Label your axes Have an “aimline” that shows what the end goal is
Aimline Shows general trajectory needed for student to reach his/her goal Typically set so student gets back “on target” or “on grade level” within a set amount of time (e.g., by the end of the year) if possible Simply draw a straight line from the student’s first data point on the graph to the date and score representing his target or goal Use SMART goals: specific, measurable, attainable, realistic, with a clear timeframe
Aimline and Setting Goals (Cont’d) For setting CBM goals Can use local norms or benchmark targets set by your district or based on national datasets and research (e.g., DIBELS targets, AIMSweb targets) Can use information on the amount of progress students who were successful have made in the past in this intervention or curriculum (e.g., what was the slope of progress in the research?)
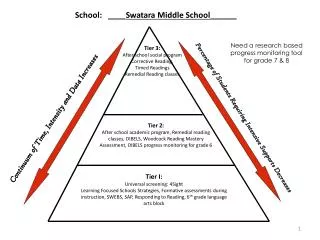
Example Gr 1-5 “Targets” for Aimline Based on the St. Croix River Education District 08-09 Targets linked to success on Minnesota Comprehensive Assessment – II
Early CBM national “norms” and growth rates in oral reading (words correct per min.) Hasbruck & Tindal 1992, Teaching Exc. Children, Deno et al, 2001 School Psych Review
Looking at the Graphs Is there “go upness”???? Is there ENOUGH “go upness”????
Data Decision Guidelines If the student has some data points above and some below the aimline (doing the “aimline hug”), keep doing what you are doing! If the student has 4 consecutive data points above the aimline, consider moving the student to less intervention (e.g., decreasing minutes, or moving from Tier 2 to Tier 1 or Tier 3 to Tier 2) Also use other pieces of information Continue to progress monitor
Data Decision Guidelines (Cont’d) If the student has 4 consecutive data points below the aimline, ASK THE FOLLOWING QUESTIONS (and continue to progress monitor): What does the “other” evidence available suggest about the student’s progress? Error rates? Behavior during the intervention? What is the general “trend” of the data? Is the student likely to get where we want if this continues? Use visual analysis and other evidence Use “trendlines” and “aimlines”
Trendline Shows the general “trend” or trajectory of the student’s data so far Web-based programs typically use an Ordinary Least Squares regression line AIMSweb, DIBELS data system, Excel Need approx. 7 to 9 data points Trendlines on few data points or on highly variable data are NOT reliable!!! Christ, T. (2006). Short term estimates of growth using CBM ORF: Estimating Standard Error of Slope to construct confidence intervals. School Psychology Review, 35(1) 128-133.
How Much Progress is “Enough”? What is “adequate” progress? Criterion referenced Will student meet goal? In reasonable amount of time? Growth is at or above “target” growth rate Norm referenced Growth is at or above growth of grade level peers Individually referenced Growth is better than before “Intervention”/research referenced Growth is similar to what was seen in research on this intervention (with similar population)
Remember to Use your Brain! (And Eyes and Ears) If overall trend of progress is good but s/he happens to have 4 data points just barely below the aimline, you may decide to continue your intervention for a week and see what happens. Use convergence of data (teacher report, mastery monitoring, behavioral indicators) These are guidelines, THINKING is REQUIRED…
Practice Exercises: Is there go upness? Is there enough go upness? What else would you like to know? What would you do? Exit to less intense service Keep going and collect more data Problem solve and change something
Finn Gr 2 CBM-ORF Reading Links 1:5 for 15 min. Aimline
Finn Gr 2 CBM-ORF (Cont’d) Added distributed practice and preteaching Reading Links 1:5 for 15 min. Aimline
Can Also Make Decisions About Exiting to Less Intensive Service!
Dealing With Bounce Is there a “measurement” problem? Fidelity of administration and scoring Materials aren’t well designed or are too difficult Who, where, and when measurement takes place can matter (esp. for some kids) Motivation issues (can’t do vs. won’t do)
Dealing with Bounce (Cont’d) Other ways to minimize bounce or make decisions despite bounce Do more probes at one time and take median or average score Do more frequent measurement (e.g., weekly or 2x week) Look at trend over time with many data points Look at ALL data together (errors, mastery data, etc.) Use the least dangerous assumption…
What if There isn’t Adequate Progress? If you keep doing what you’ve been doing then you will keep getting what you’ve got.
What if There isn’t Adequate Progress? Is the intervention being done with fidelity? Has fidelity checks been done? Is the student in the right level of materials? Has the student been in school? Are they getting enough minutes of intervention per week?
What if There isn’t Adequate Progress? (Cont’d) Should the intervention be “tweaked”? Changed? Is there an intervention better “matched” to this student’s needs? Changes could include trying a different intervention or just “tweaking” the current intervention such as adding a 5th repeat to a repeated reading or a sticker incentive for accurate reading. Grade level or problem solving team members work together to discuss the data, the student, and what intervention changes would have the best chance of success.
What Could We Change? Focus or skill Teaching strategies: More explicit, more modeling, more practice, more previewing, better matched with core Materials: Easier, better matched (cultural, interests, etc.) Arrangements: Size group, location, who is teaching? Time: Amount of time, days per week, time of day Motivation: Interests, goals, rewards, home/school
Adam, Gr 4 Benchmark data Winter: 85 wrc (target= 114) Fall: 89 wrc (target= 93) Error rate moderate (4, 4, & 6) Very inconsistent academically; good attendance but attention, accuracy and work completion issues; basic decoding skills ok; can correct errors; can read better (with expression, meaning) in high interest material? Grade Level Team put Adam in Tier 2 intervention- working with MRC 1:1 on repeated reading intervention 20 min per day
If We Do Change, What Should We Change? What else would you want to know about Adam and his intervention, curriculum and class? What are at least 5 different ideas for changes that could be made? Is this likely to be a tweak or a major shift? How would you know if you made a good decision?
Sharing the Data Just having progress monitoring data is not enough. You need to USE it. Scheduled graph review dates Grade level meetings Problem solving meetings
Remember: Garbage IN…. Garbage OUT…. Make sure your data have integrity or they won’t be good fer nuthin… Training Integrity checks/refreshers Well chosen measures and materials
Avoid Common Mistakes Don’t use the same passage/probe every week! Have an organized system in place Progress monitoring schedule for students Preprinted passages/probes in a binder An easy way to graph and look at the data Scheduled time to share/look at the data
Remember… When teachers USE progress monitoring Students learn more! Teachers design better instructional programs Teacher decision making improves Students become more aware of their performance Safer & Fleishman, 2005